Price Experiences Series Declines – March 23
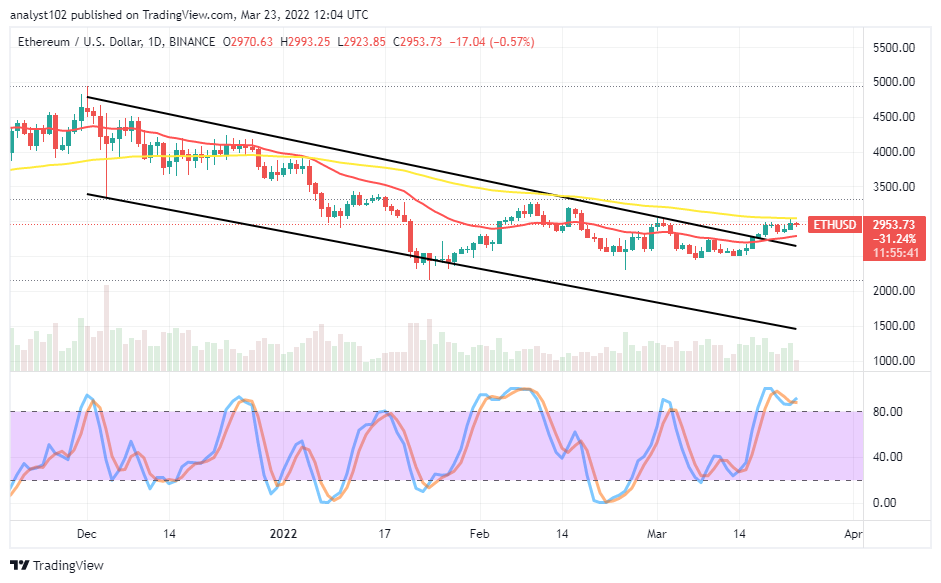
There has been a return of an upward-moving motion in the ETH/USD trade activities as the crypto-economic market witnesses a swing high in its valuation. Price is trading around $2,953 between the high and the low values of $2,993 and $2,923, keeping a minute negative percentage of 0.57.
Price Experiences Series Declines: ETH Market
Key Levels:
Resistance levels: $3,000, $3,250, $3,500
Support levels: $2,750, $2,500, $2,250 ETH/USD – Daily Chart
The ETH/USD daily chart reveals the crypto-economic market witnesses a swing high tightly beneath the trend line of the bigger SMA. Variant candlesticks have been featuring closely around the $3,000 level. The 14-day SMA indicator is underneath the 50-day SMA indicator. The upper bearish trend line drew southwardly against the smaller SMA at the last end. The Stochastic oscillators are in the overbought region. And they are seemingly trying to embark upon a consolidation movement within it.
Can the ETH/USD trade bulls push for a long-term running above the $3,000 as the market witnesses a swing high?
It is a re-occurrence of the usual re-featuring of ups in the ETH/USD trade if bulls lack the catalyst to breathe life into the crypto economy to push for a long-term running above the $3,000 resistance level. It recorded that the crypto-economic market witnesses a swing high. A continual process of price rejections around the value-line will denote a falling force is in the offing.
On the downside of the technical analysis, the ETH/USD market bears are to be on the lookout for decent shorting entries around the 50-day SMA trend line. A more visible sell entry order will achieve if a pull-up emerges but, in no time, happens to turn a fake. It requires a lot of patience before that assumption can play out. Some falling forces are to play out around the $3,000. Therefore, investors may also have to wait until the market comes down lower again before considering joining.
ETH/BTC Price Analysis
In comparison, Ethereum pushes against the trending capacity of Bitcoin to a notable higher spot not too far above the bearish trend line. The 50-day SMA indicator is above the 14-day SMA indicator. The positioning of the bigger SMA trend line against the candlesticks suggests firm retardation to getting smother-ups for the base crypto. The Stochastic oscillators are in the overbought region. And they are relatively trying to begin a consolidation moving style within as they have conjoined their lines. The base crypto may fall in the subsequent sessions.
Looking to buy or trade Bitcoin (BTC) now? Invest at eToro!
68% of retail investor accounts lose money when trading CFDs with this provider.
Read more:


