Litecoin Price Increases in Rallying motion– March 30
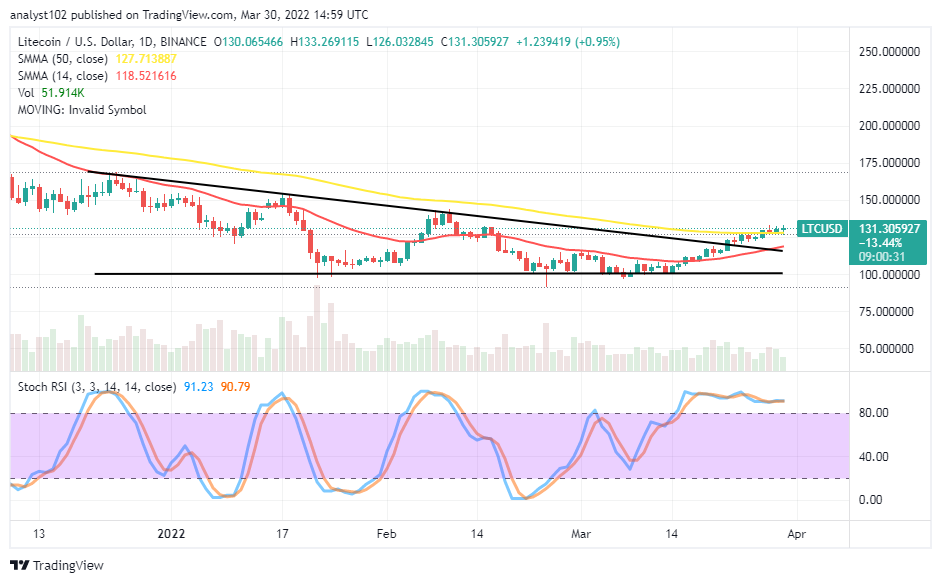
It is still apparent that the LTC/USD market activities still hold values at a higher resistance as the crypto-economic price increases in rallying motion. The crypto economy is around $131 between the high and the low of $133 and $126, keeping a minimal positive percentage rate of 0.95.
Price Increases in Rallying motion: LTC Trade
Key Levels:
Resistance levels: $135, $145, $155
Support levels: $120, $90, $80 LTC/USD – Daily Chart
The LTC/USD daily chart shows the crypto-economic price increases in rallying motion toward the north. The 14-day SMA indicator slightly curves toward the north beneath the 50-day SMA indicator. Smaller candlesticks are continually featuring slightly over the bigger SMA trend line. The Stochastic Oscillators are in the overbought region, moving in a consolidation manner to depict that a force to the upside is still in progress.
Is it safe to start shorting positions in the LTC/USD market as price increases in rallying motion?
It is still somewhat that the LTC/USD market sellers are gathering momentum until the present as the crypto-economic price increases in rallying motion. Long-position takers have been careful to either pause or to continue pushing in the way of rallying motion around a higher level of $130. From the technical point of view, it is not ideal to go for more opening of new long orders.
On the downside of the technical analysis, the LTC/USD market short-position takers are to be on the lookout for price rejections around a higher resistance trading level. Some barriers are piling up as price holds, increase for rallying motion around the 50-day SMA trend line. It likely price downsizes in value while it cannot hold firmly above the $135 resistance level in the long run.
LTC/BTC Price Analysis
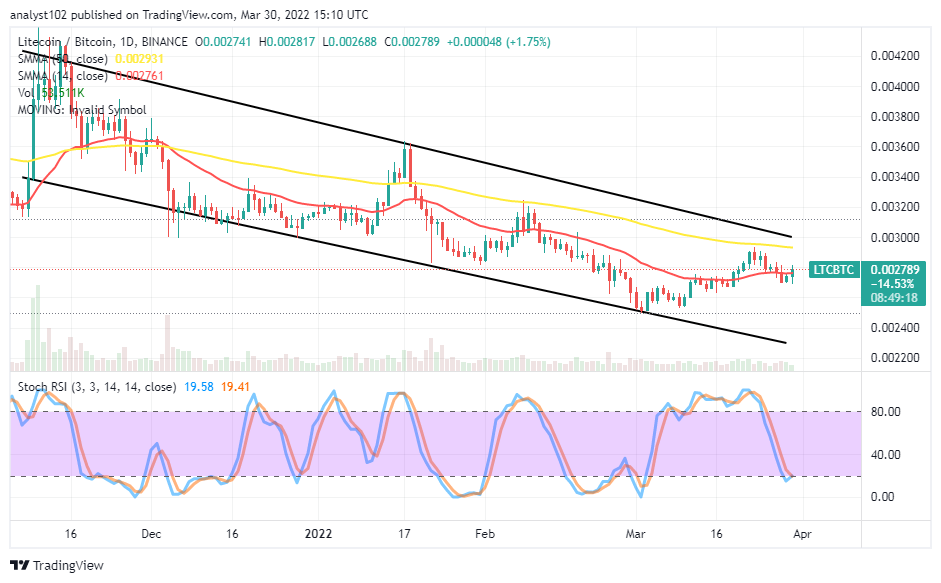
In comparison, Litecoin, as the base cryptocurrency, is now striving to regain its stance against Bitcoin. Lately, the counter crypto exerted a force on the base crypto as the price went down, back to trade around the trend line of the smaller SMA. The 50-day SMA trend line is above the 14-day SMA trend line. The Stochastic Oscillators are down closely at the range of 20, trying to close the lines around the range line. A chain of bullish candlesticks is in the making, signifying the base crypto may attempt to push northward back soon.
Looking to buy or trade Bitcoin (BTC) now? Invest at eToro!
68% of retail investor accounts lose money when trading CFDs with this provider
Read more:


