Price is Trying to Recuperate – April 27
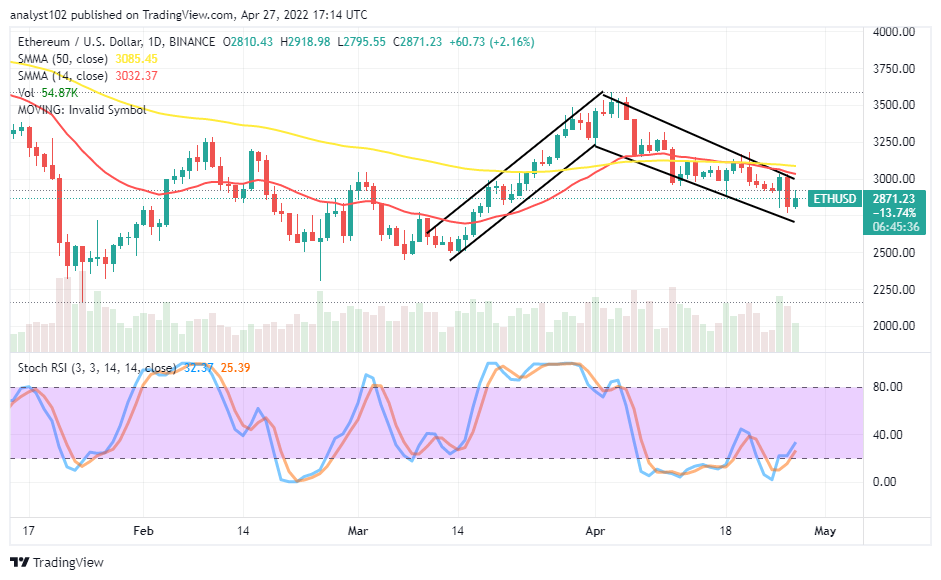
The recent downward-moving still featured within a well-set pattern denoting an expectation to see the ETH/USD market operation making rebounding moves after a notable downing course. In a compliance trait, the ETH market price is trying to recuperate after averaging a particular psychological lower point as it trades between $2,918 and $2,795 at 2.16 % positive.
Price is Trying to Recuperate: ETH Market
Key Levels:
Resistance levels: $3,000, $3,250, $3,500
Support levels: $2,750, $2,500, $2,250 ETH/USD – Daily Chart
The daily chart showcases the ETH market price is trying to recuperate from a lower-trading spot within the bullish flag pattern drawn against the SMA trend lines. The 14-day SMA indicator has breached past the 50-day SMA indicator to the south. And they are over the current market trading zone, indicating the situation is under falling pressure. The Stochastic Oscillators have crossed their lines northbound slowly from the oversold region to reach a closer range beneath the 40 range line. A bullish candlestick is in the making to signify that a buying spree is ongoing.
Will the ETH/USD market bears consolidate beneath $3,000 to eventually break down at $2,750 as the market price is trying to recuperate?
The ETH/USD market bears may have resistant-trading power of around $3,000 against some upswings that can feature in the crypto economy regarding the present moving force strength. But, the price to break down at the $2,750 support level may not achieve in the near term. There is a point around the value line to allow ETH regains its lost momentum on a full scale.
On the downside of the technical analysis, the ETH/USD market bear, in an actual technical trading viewpoint, have to make the SMA trend lines instrumental in their decision making by watching out for when the market will get a resistance around them to get a decent sell entry. They needed to back the execution of their orders with active reversal force around the trading indicators afterward.
ETH/BTC Price Analysis
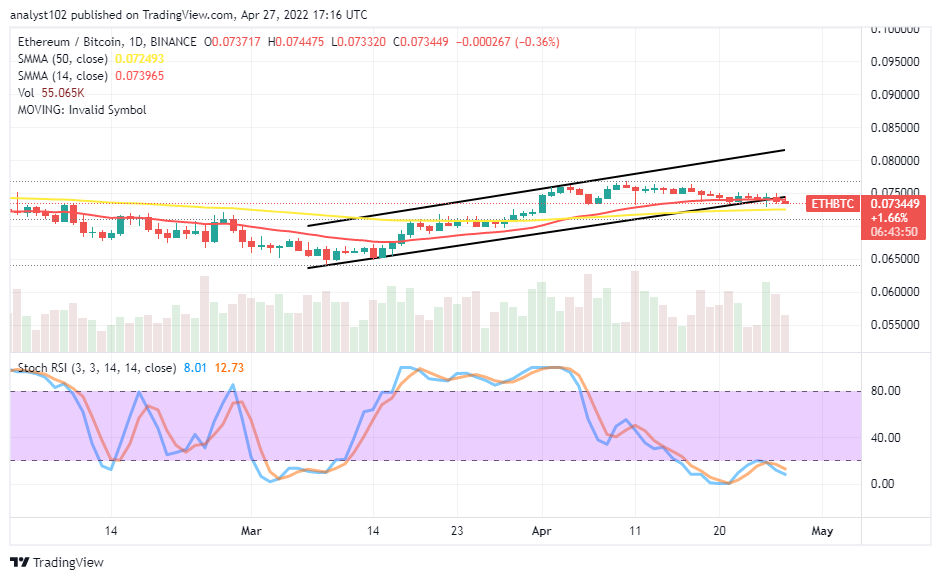
In comparison, Ethereum appears not to give in to downing pressures inflicted on the crypto-economic market operations by Bitcoin. Generally, crypto economies experience downward trends. The cryptocurrency pair market price in question is trying to recuperate around the SMA trend lines. The 14-day SMA indicator is closely above the 50-day SMA indicator. The Stochastic Oscillators are in the oversold region, slightly pointing toward the south direction beneath the range of 20. That suggests the base trading crypto may still go southward for a while against the countering crypto instrument.
Looking to buy or trade Bitcoin (BTC) now? Invest at eToro!
68% of retail investor accounts lose money when trading CFDs with this provider.
Read more:


