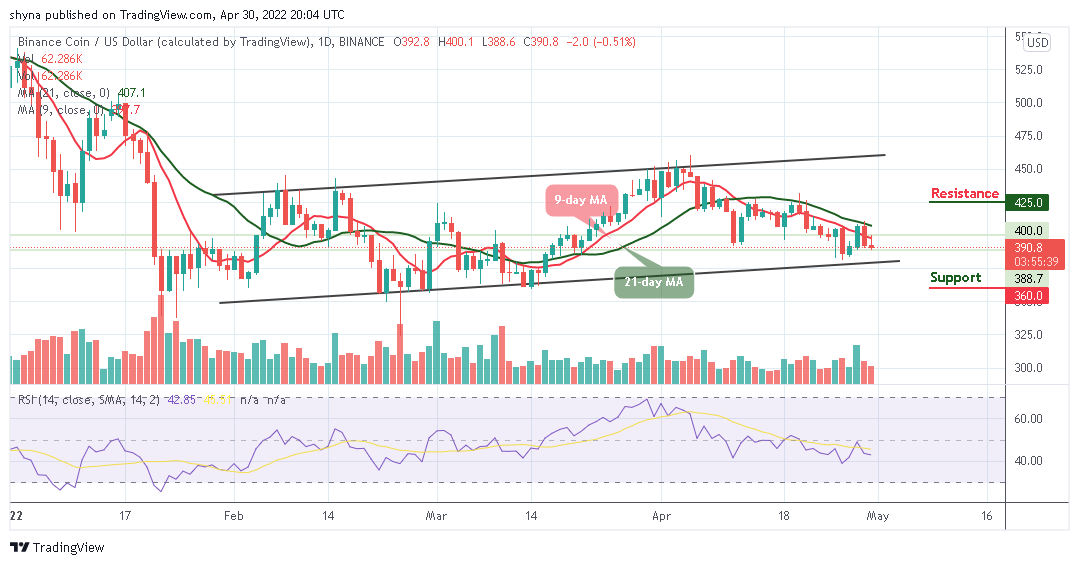
The Binance Coin price prediction still maintains sideways movement but couldn’t break above the 9-day and 21-day moving averages.
BNB/USD Market
Key Levels:
Resistance levels: $425, $435, $445
Support levels: $360, $350, $340

At the time of writing, BNB/USD begins the day with a bullish movement, after which it touches the low of $388 support. However, the coin is moving towards the lower boundary of the channel. More so, the current market situation isn’t impressive at all. A couple of days ago, the BNB price was spotted dealing at a high of $408 and a low of $388.
Binance Coin Price Prediction: Binance Coin (BNB) May Decline Heavily
Looking at the daily chart, the $425, $435, and $445 are significant resistance levels if the bulls push the Binance Coin price above the 9-day and 21-day moving averages. On the downside, if the price experiences a break below the lower boundary of the channel, it could cause a bearish wave, and beneath this, further supports could be found at $360, $350, and $340. The technical indicator Relative Strength Index (14) is likely to cross below 40-level, suggesting a price drop.
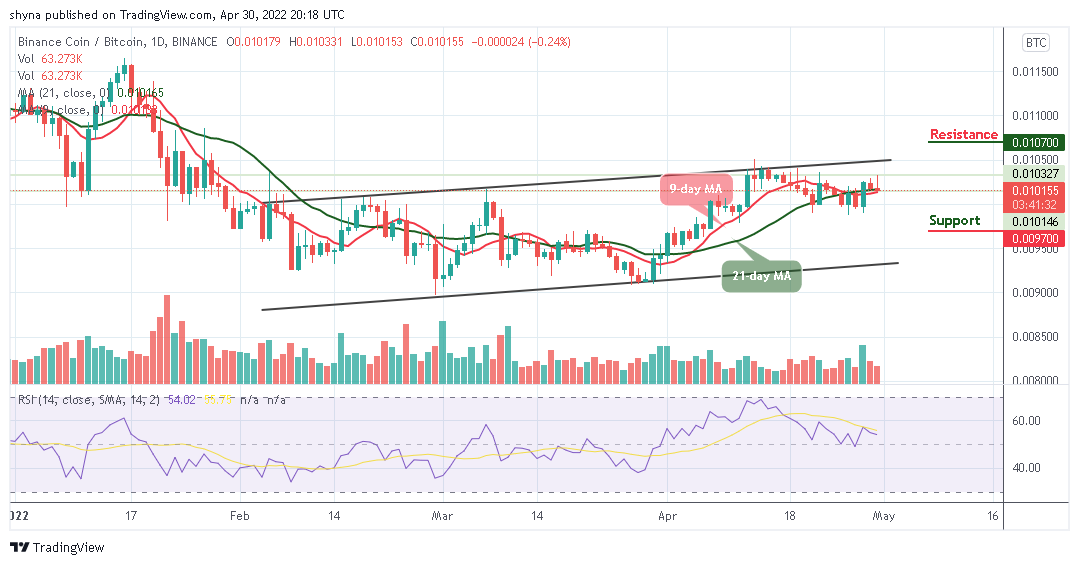
Against Bitcoin, BNB is looking to retest the support at 1000 SAT as the coin moves to cross below the 9-day and 21-day moving averages. However, the Binance coin price has been moving sideways for the past few weeks, and looking at it from above, the nearest level of resistance lies at 1050 SAT. Above this, higher resistance could be located at 10700 SAT and above.

However, from below; the nearest level of support is found at 9900 SAT. Beneath this, the coin may slide towards the lower boundary of the channel. Lower support could be found at 9700 SAT and below. Meanwhile, the technical indicator Relative Strength Index (14) is around 54-level, which shows that the coin is likely to move sideways. On the other hand, traders may need to see BNB/BTC rise and break above the upper boundary of the channel.
Read more:


