Klaytn (KLAY) Price Prediction – May 26
The KLAY market activity trades in a range outlook under depression as its trading worth is around the value line at $0.44. The market’s all-time since two years ago stands at $0.05733. And its all-time high remains at $4.38 as it currently keeps a negative percentage of 4.23 in the last several hours.
Klaytn (KLAY) Price Statistics:
KLAY price now – $0.4427
KLAY market cap – $2.1 billion $1.3 billion
KLAY circulating supply – 20.7 billion 2.8 billion
KLAY total supply – 50 billion 10.8 billion
Coinmarketcap ranking – #44
KLAY/USD Market
Key Levels:
Resistance levels: $0.60, $0.70, $0.80
Support levels: $0.40, $0.30, $0.20 KLAY/USD – Daily Chart
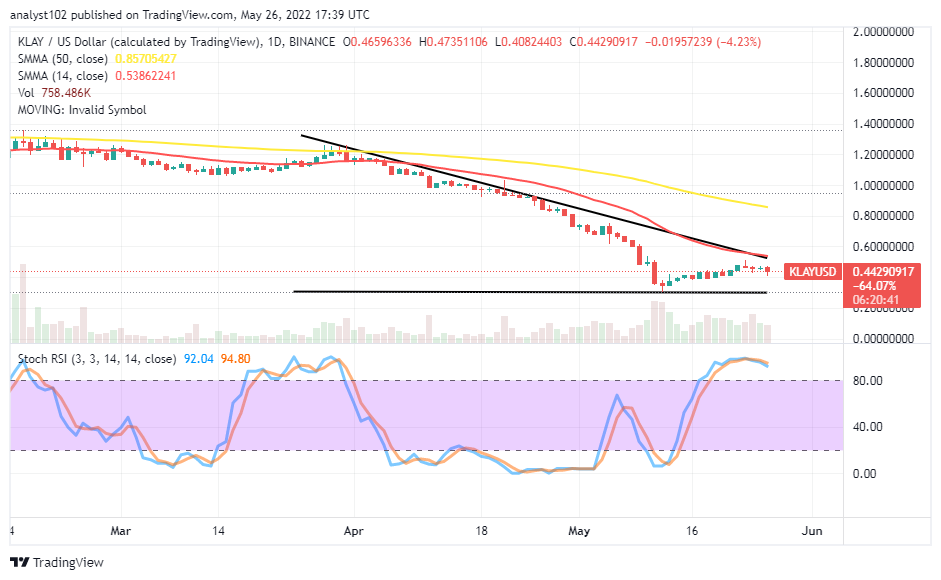
The daily chart shows the KLAY/USD market operation trades in a range outlook under a depression settling underneath the trend lines of the SMAs. The 14-day SMA indicator is close above the range-trading spot as the 50-day SMA is above it. A horizontal line drawn around at the $0.40 support, showcasing the value line has been a critical zone to getting sustainable downs afterward. The Stochastic Oscillators are deep in the overbought region, trying to curve southbound within. That signifies the probable trait of the market running in a bearish motion soon.
Will the KLAY/USD market change the direction out of ranging soon?
There can be an elongated-moving process of the current range-trading situation to the downside until the KAY/USD market price finds support around the $0.40 pivotal support level. A fearful downing force against the value line will lead to a lower support-trading point. There is a tendency for a northward bounce, occurring among the set of support levels when an aggressive motion surfaces.
On the downside of the technical analysis, variant resistance settings are in the $50 and the $60 value lines as indicated by the 14-day SMA indicator. Any forceful downing motion that can emanate from them will allow short-position takers a good chance of getting a decent selling order. The only fearful analytics thought is that the market has not been running in a volatile manner to ensure early knowledge of the trade position stature.
KLAY/BTC Price Analysis
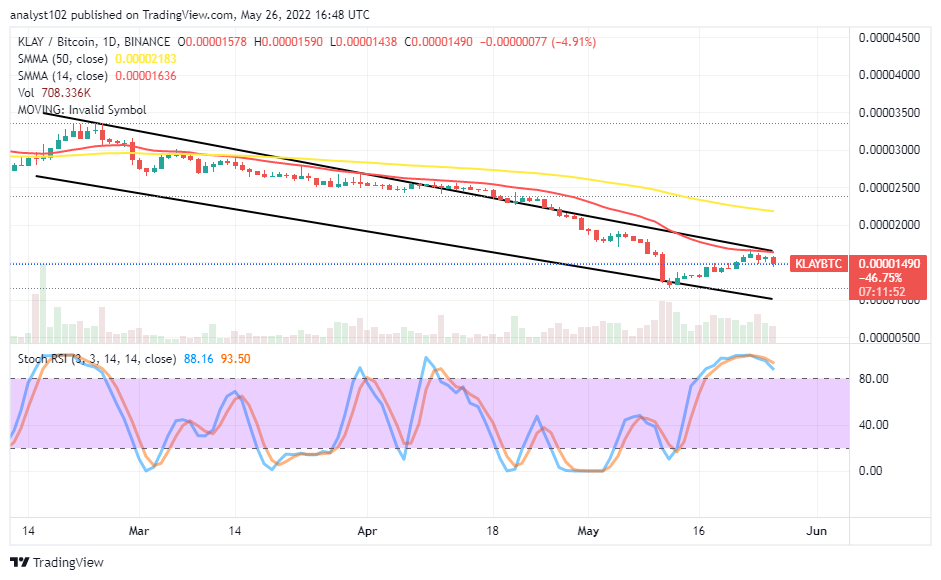
In comparison, as it has over time observed that the trending weight of Bitcoin has caused debase in most of its base crypto, Klaytn isn’t also spared. Presently, the cryptocurrency pair market trades in a range outlook under a depression setting. The 14-day SMA indicator is above the 50-day SMA indicator. The bearish channels are downwardly below the nigger SMA. The Stochastic Oscillators have been in the overbought region, trying to curve southbound within to indicate that a downing force will soon occur against the base crypto to the advantage of the counter trading crypto.
Looking to buy or trade Klaytn (KLAY) now? Invest at eToro!
68% of retail investor accounts lose money when trading CFDs with this provider.
Read more:


