Litecoin Gradually Loses in Sideways – May 28
Litecoin, the crypto listed as the number 19th ranked, gradually loses sideways as it trades against the US dollar’s valuation of around $62 at a 1.63 percent positive.
Litecoin (LTC) Statistics:
LTC price now – $62.37
LTC market cap – $4.4 billion
LTC circulating supply – 70.4 million
LTC total supply – 84 million
Coinmarketcap ranking – #19
LTC Trade
Key Levels:
Resistance levels: $75, $95, $115
Support levels: $50, $40, $30 LTC/USD – Daily Chart
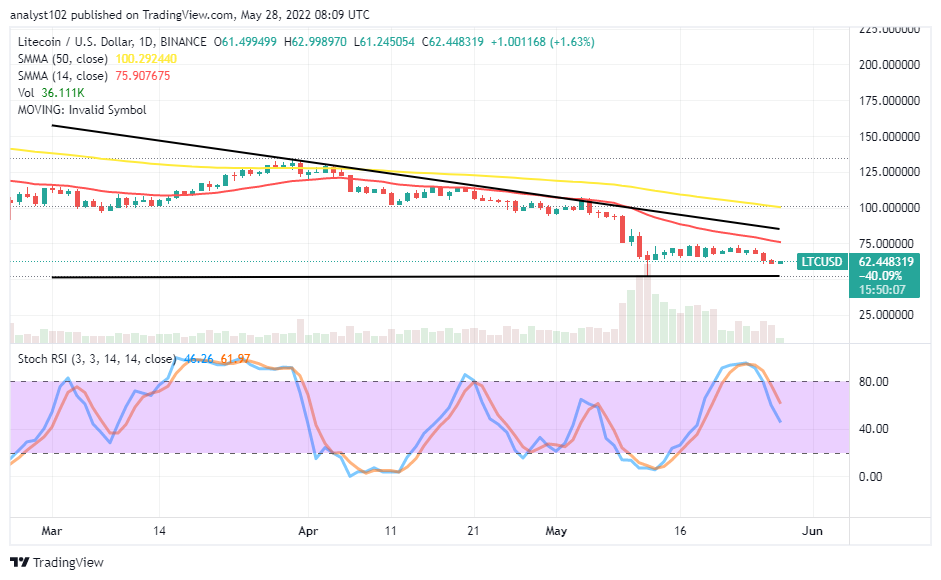
The daily chart reveals the crypto-economic price gradually loses sideways, trading in the range-bound zones of $75 and $50. The 14-day SMA indicator is underneath the 59-day SMA indicator. Presently, the trading situation doesn’t seem down further in an aggressive manner toward the horizontal line drawn at the $50 support level. The positioning posture of the Stochastic Oscillators from the overbought region against some range lines closer to the 40 suggests the purchasing power of the US fiat currency will still somewhat suppress the valuation of LTC for a while.
Will the LTC/USD trade push downward past the lower range line at $50 soon afterward?
The LTC/USD trade will not be pushing down past the lower range line at $50 soon as it gradually loses sideways within the range-bound zones of $75 and $50. It would be technically ideal for long-position takers to patiently wait for a pattern that will support an outlook comprised of lower highs around the range line at $50 before nursing a notion to consider launching a buying order.
On the downside of the technical analysis, the LTC/USD market operation appears to be under suppression as the $75 resistance level may remain to breach northward over several sessions. Bears may intensify efforts to push for profiteering past the $50 support level to cause unnecessary panic sell-off conditions. Price may hold for a while in a lower-trading zone to allow bulls to muster up the energy.
LTC/BTC Price Analysis
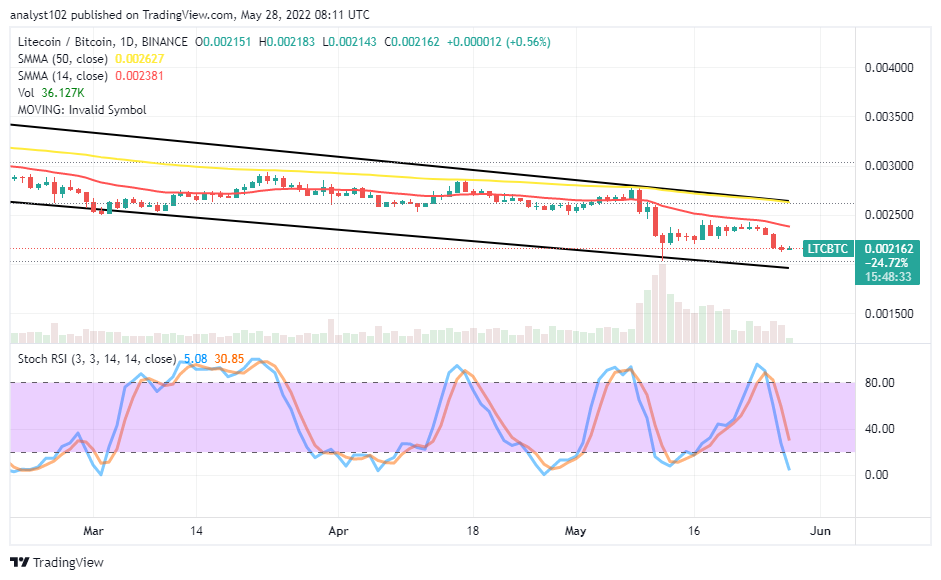
Litecoin‘s pushing capacity is running under a falling force pairing with Bitcoin’s trending outlook. The cryptos’ pairing arrangement signifies price gradually loses sideways underneath the trend lines of the SMAs. The bearish channel trend lines drew southward to embody all that has to do with the trading activities. The Stochastic Oscillators are in the oversold region to suggest a close-end approach to the downing in the near time. That means the base crypto, expectantly, will soon be gaining stances to reclaim its lost momentums trading against the trending weight of the flagship counter crypto.
eToro – Automated Copytrading of Profitable Traders
- 83.7% Average Annual Returns with CopyTrader™ feature
- Review Traders’ Performance, choose from 1 – 100 to Copytrade
- No Management Fees
- Free Demo Account
- Social Media & Forum Community – Trusted by Millions of Users
Read more:


