DOT has been trending upwards since late July. And, the fight has to be a toe to toe one between the bulls and the bears. However, since the crypto has generally gone upwards then we can say that the bulls have emerged as the winner. Nevertheless, at this point again the market is once at a point at which we have to decide what will happen next.
Polkadot Forecast Statistics Data:
Polkadot current price: $9.26
Polkadot market cap: $10.2 billion
Polkadot circulating supply:1.11billion
Polkadot total supply: 1.2 billion
Polkadot Coinmarketcap ranking: #10
It is very Germaine for us to critically examine the signs here, and deduce a better step to take. In this forecast, we shall try to find out the possibilities in this market. We will try to come up with action that may assist us to get the best from this market.
Key Levels:
Resistance levels: $0.0690, $0.0700, $0.0708
Support levels: $0.0687, $0.0675, $0.0655

Polkadot Price Forecast: DOT/USD Appears to Be Pushing Higher
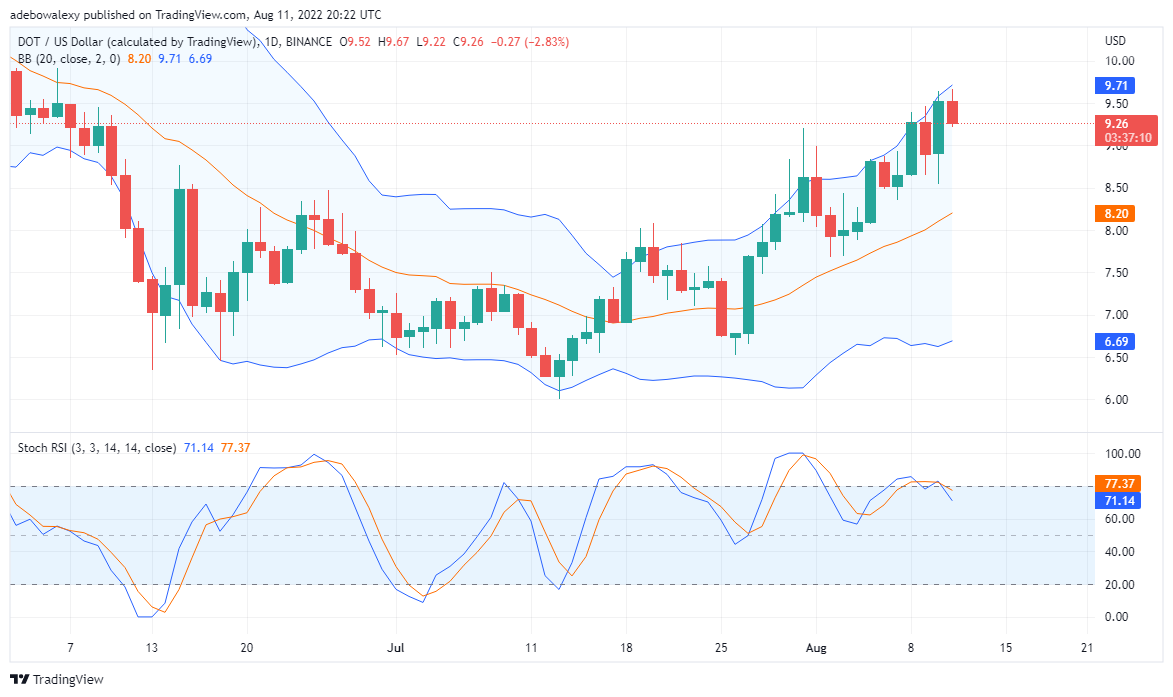
Examining the DOT/USD chart will reveal that this market may keep pushing higher. We can see here that price actions remain significantly above the middle line of the Bollinger Band. Also, we can see that the Bullish candles appear bigger than the bearish ones. Particularly, we can see that the last bearish candle could not bring the price below the middle of the previous bullish candle. Summing up all the signs here we may assume that the price may resume upward movement. However, that will depend on if the DOT does not face too much selling pressure.
Furthermore, the Stochastic RSI has made a downward facing cross, which indicates a downtrend. Yet the main determinant remains how much selling pressure the market faces. Moving on, it will be safer to anticipate a downtrend, and traders should place their stops around $8.70 or $8.80. So, if the stop isn’t triggered, then it means the price has moved on upwards.

Polkadot Price Forecast: Will DOT/BTC Correct Downward From Here?
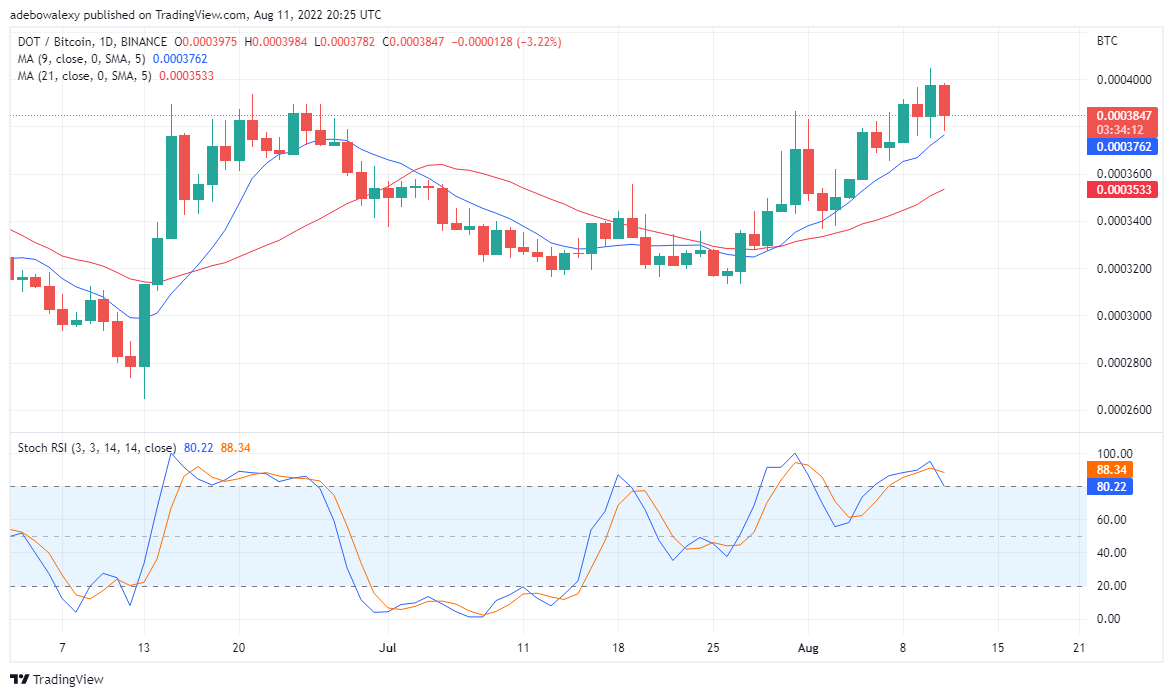
Looking at the DOT/BTC chart it won’t be bad to assume that the price will continue its upward trend. Nevertheless, it is necessary for us to critically examine this trend through trading mechanisms. Here it could be perceived that the price candle has been alternating between bearish and bullish once. However, considering the Moving Average curves, well see that perhaps the bulls are tiring at this point. We can observe that the MA lines are getting widely separated, with the faster blue one moving closer to the price candle. Furthermore, the faster MA line seems to be trying to cross above the price of candles. If this eventually happens, this may bring DOT to the range. Also, should the slower MA follow the faster one, then the price will plunge downwards.
Buy Dogecoin Now Your capital is at risk.
Furthermore, the Stochastic RSI has made a downward facing cross which indicates a downtrend. Nevertheless, most of what will happen next will be decided by how much selling pressure the pair will face henceforth. The best is to prepare for the possible occurrence of a downtrend. Therefore Traders who enter the market earlier this month should adjust their Stop to around 0.0003650. And, Should the bull continues to win such may stay on in the market.
Related


