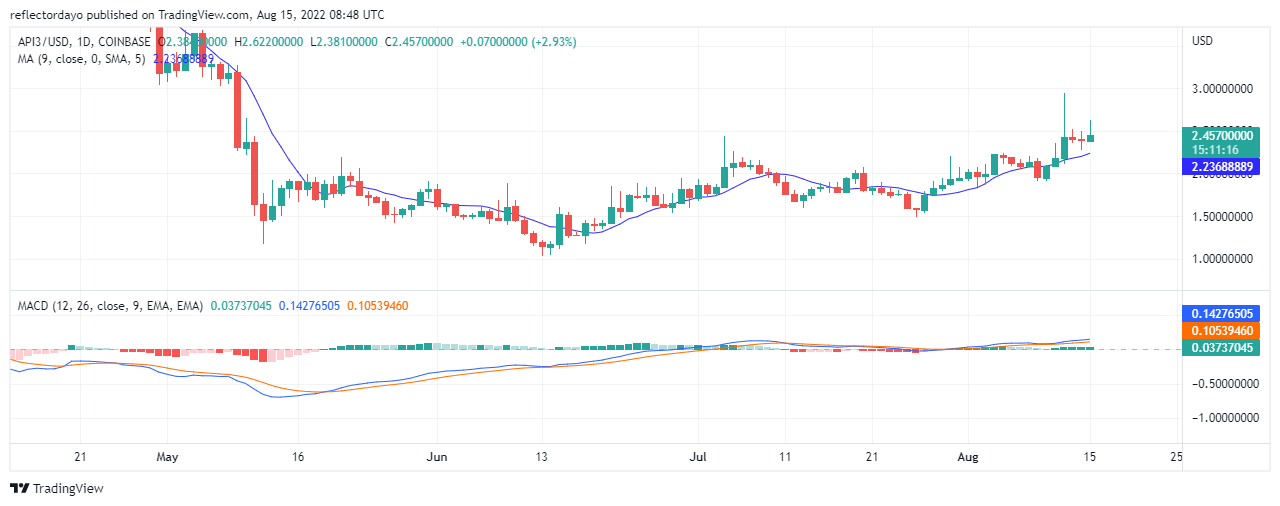
After two days of intense struggle between the bulls and the bears, the bulls finally take the control of the market. On the 13th and 14th of August we see from the candlesticks that it was a serious battle between buyers and sellers. But, at the end of the two days, the market end in favour of the bears. The bears could not hold their ground for long, as we can see the bullish movement of API3/USD. On a general outlook, we can say that the API3/USD is in an uptrend.

API3/USD Price Statistic Data
- API/USD price now :- $2.4440000
- API/USD market cap:-$ 140 million
- API/USD circulating supply:- 56,547601 API3
- API/USD total supply:- 113,912,052 API3
- API/USD coin market cap rank:- #170
Key Levels
- Resistance: $2.00262285, $2.22303594 $2.43343026
- Support: $2.162972328, $1.95252897, $1.56179667
Your capital is at risk
Price Prediction for API3/USD: A Look at the Indicators
On the 12th August the price action took a 11.5% leap above the 9-day moving average. This signifies that API3/USD has begun soar. The bears tried to draw them down, but today the market go in favour of bulls. The Moving Average Convergence and Divergence indicator records a difference of 0.03737045 between the MACD line and the signal line. The Relative Strength Index measures a momentum strength of 66.93%.
The API/USD 4-Chart Outlook
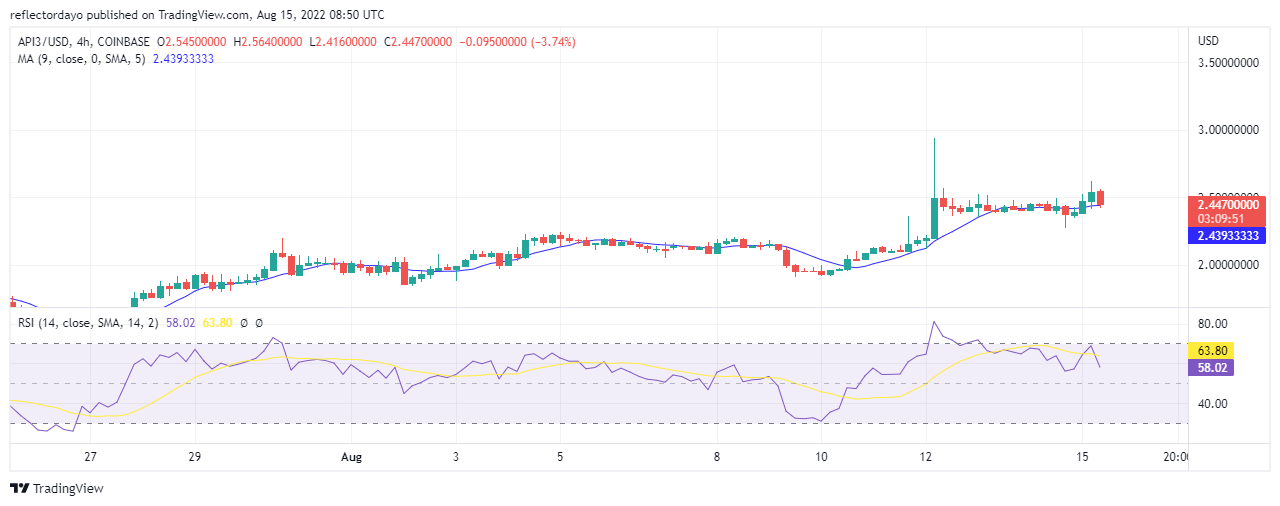
On the 4-hour chart outlook, there is a serious tug-of war between the bulls and the bear. We are not sure as to whom the market is going to close in favour of. The RSI reading is dropping. For now, it stays at 58%.It is likely that the market may be held up at the resistance level of $2.43343026
Related
Tamadoge – Play to Earn Meme Coin
- Earn TAMA in Battles With Doge Pets
- Capped Supply of 2 Bn, Token Burn
- NFT-Based Metaverse Game
- Presale Live Now – tamadoge.io


