Solana has been experiencing moderate gains, as it trades inside an upward-slopping price channel. Although the price of SOL price remains significantly bullish, there are signs of possible price correction. We may hope for the aforementioned reversal to be short-lived, nevertheless, it is essential for us to carefully examine this market before making such claims.
Solana’s Forecast Statistics Data:
Solana’s current price: is $46.08
Solana market cap: $15.74 billion
Solana systemic supply: 348.71 billion
Solana overall supply: 511.62 billion
Solana Coinmarketcap ranking: #9
In this Forecast, we shall analyze the Solana market, to come up with useful trading advice. Without wasting time no further, let’s dive in straight away.
Major Price Levels:
Top levels: $44.50, $45.50, $46.78
Bottom levels: $46.08, $45.75, $45.00

Solana Price Analysis: SOL/USD Claiming Decent Profits
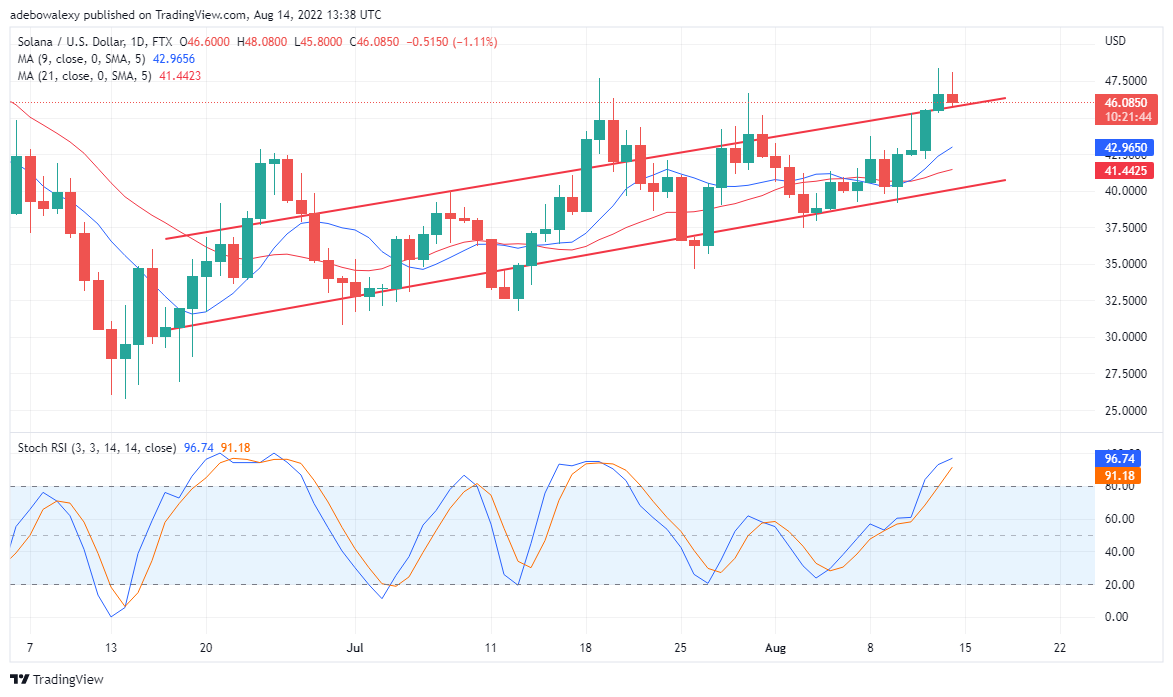
The SOL/USD daily chart shows that the bears are beginning to initiate some setbacks in this market. However, this is only coming after the bulls have moved prices significantly high enough. And, at this point, it seems like before significantly high, such that it will require more effort from being bear to plunge Solana’s value low enough.
We can see that recent price actions are above the Moving Average lines. This should that price is in an uptrend. Although the 9-days MA line is getting closer to the price candles yet it seems like more bears will be needed to make this line cross above the price candles. Consequently, this implies that the uptrend is strong. Additionally, the Stochastic RSI indicator lines are now bending towards each other as if to be attempting a cross. However, unless the bears increase in strength, it is unlikely that these lines will eventually cross each other to signify a downward trend. Therefore, Traders in this market may only need to adjust their stops to a comfortable level. Eventually, the price may find new resistance around $47.50 and $50.00.

Solana Price Analysis: SOL/BTC Looks Bullish But on a Smaller Scale
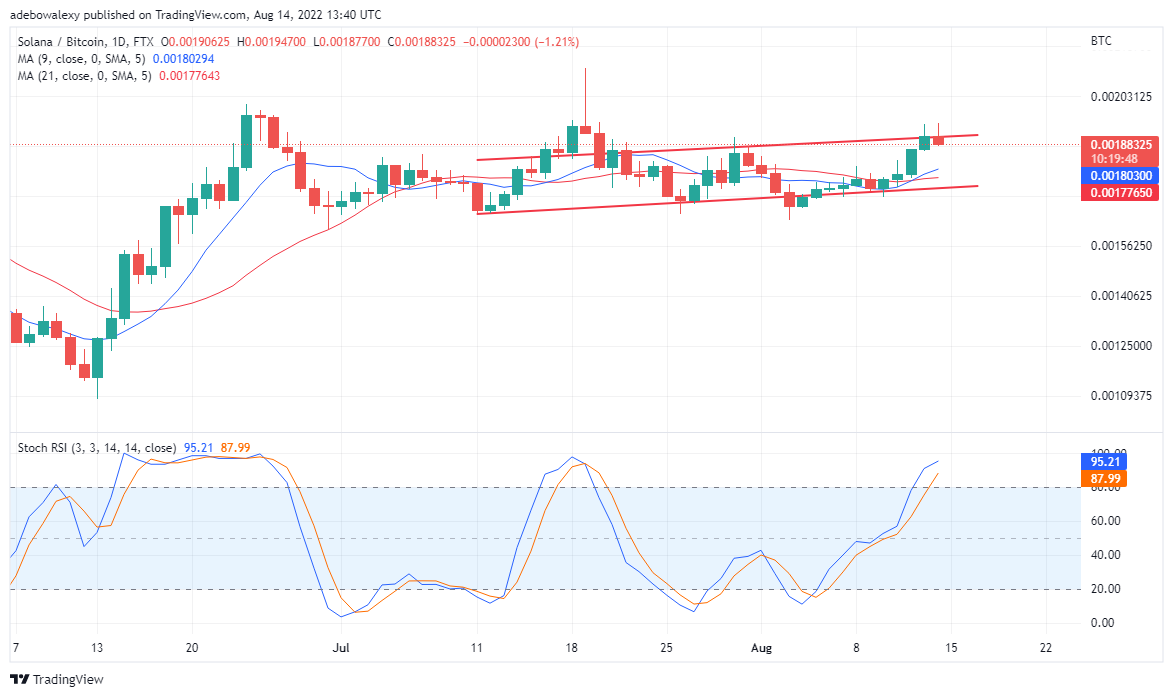
SOL/BTC daily chart look somewhat similar to that of the SOL/USD. Nevertheless, we can perceive that the bulls are more conservative in this market. Also, like what we have on the SOL/USD price stays significantly above the MA lines. More effort may be needed by the bears to bring price action to a downtrend.
Your capital is at risk.
Also, the Stochastic RSI appears bending towards the slower one. This is showing us the influence of the last bearish candlestick on this chart. However, unless more bearish candles show up on this candle, Solana may not begin a downtrend. Furthermore, the price may soon find resistance near 0.002031. Additionally, Traders can also adjust their stops around 0.001777.
Related
Tamadoge – Play to Earn Meme Coin
- Earn TAMA in Battles With Doge Pets
- Capped Supply of 2 Bn, Token Burn
- NFT-Based Metaverse Game
- Presale Live Now – tamadoge.io


