Binance Coin Price Prediction – August 23
It has been that Binance Coin holds fewer declines in its valuation against the trading worth of the US Dollar. The market maintains an average minute percentage rate of 0.40 negative, trading around $297.
Binance Coin Price Statistics:
BNB price now – $297.65
BNB market cap – $47.9 billion
BNB circulating supply – 161.3 million
BNB total supply – 161.3 million
Coinmarketcap ranking – #5
Binance Coin Market
Binance Coin Market
Key Levels:
Resistance levels: $325, $350, $375
Support levels: $270, $250, $230 BNB /USD – Daily Chart
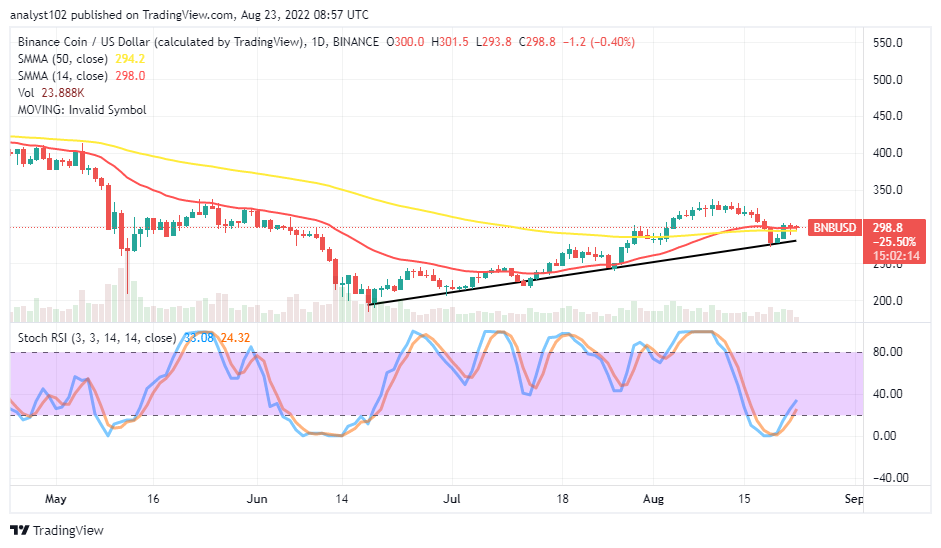
The BNB/USD daily chart showcases the crypto-economic market holds fewer declines around the trend lines of the SMAs. The 14-day SMA indicator is at $298 above the 50-day SMA indicator’s value line at $294.20. The bullish trend line is drawn northward to the extent to which the price has reduced over time. The Stochastic Oscillators have crossed northbound from the oversold region, keeping the range points of 33.08 and 24.32.
Your capital is at risk.
Should the BNB/USD trade sellers follow any move that tends to break down at the bullish trend line?
It may technically not be ideal for the BNB/USD trade sellers to follow any move that tends to break down at the $280, the higher point level of it as the crypto’s price holds fewer declines beneath the correctional starting value line obtained recently around the $325. Buying activities may resume while gravitational force to the downside found too weak to breach through variant supports penultimate before the $270 support level in the long run.
On the downside of the technical analysis, as of the time of writing, the BNB/USD market bears may not have a decent sell entry point until other rounds of formation occur. An overbought condition reading by the Stochastic Oscillators will give a reliable insight into when there will be time to launch logical shorting orders afterward. Therefore, short-position placers have to maintain a culture of caution at this moment.
BNB/BTC Price Analysis
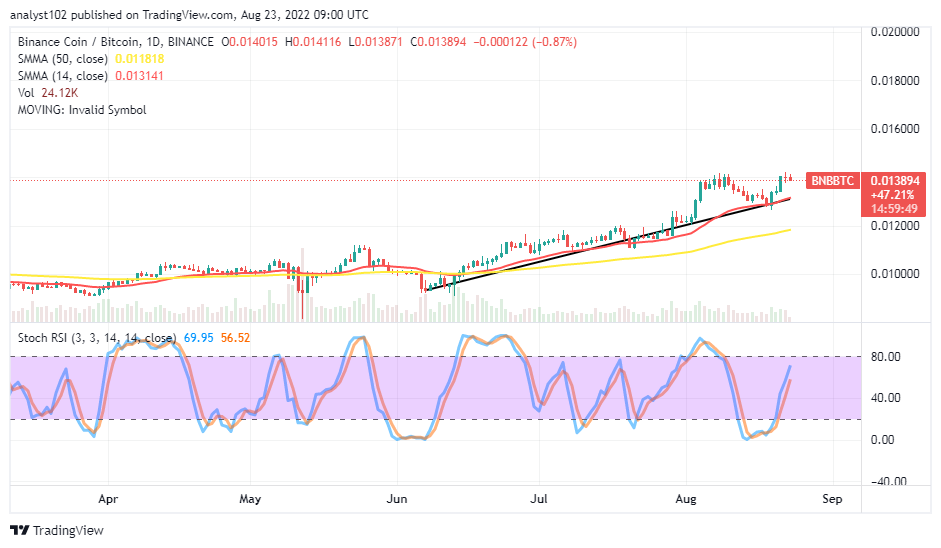
Binance Coin appears to keep a higher-trending outlook against the capacity of Bitcoin. The cryptocurrency pair price holds fewer lines of points over the trend lines of the SMAs. The bullish trend line at some point aligned with the 14-day SMA indicator above the 50-day SMA indicator. The Stochastic Oscillators have crossed northbound, reaching the 56.52 and 69..95 range values. A bearish candlestick appears in the making to signal the base crypto is on the verge of losing the strength to push more against its counter crypto.
Tamadoge – Play to Earn Meme Coin
- Earn TAMA in Battles With Doge Pets
- Capped Supply of 2 Bn, Token Burn
- NFT-Based Metaverse Game
- Presale Live Now – tamadoge.io
Read more:


