Shiba Inu price action rose to higher resistance via a bullish candlestick on a daily chart recently. However, over time an opposite downward correction occurred. This is because the massive price jump triggered selling moves. The resumption of selling pressure drove Shiba back downward by 27%. Currently, by careful observation, we can see that the price of this coin is preparing to correct upwards. Before making such conclusions let’s examine the signs here.
Shiba Inu Analysis Statistics Data:
Shiba Inu Current Price: $0.00001300
Shiba Inu Market Capitalization: $7.1 billion
Shiba Inu Systemic Supply: 549.1 billion
Shiba Inu Overall Supply: 589.7 trillion
Shiba Inu Coinmarketcap Position: #12
Key Price Levels:
Top Levels: $0.00001350, $0.00001383, $0.00001400
Bottom Levels: $0.00001341, $0.00001320, $0.00001300

SHIB Sellers Are Looking Exhausted, Buy TAMA Today
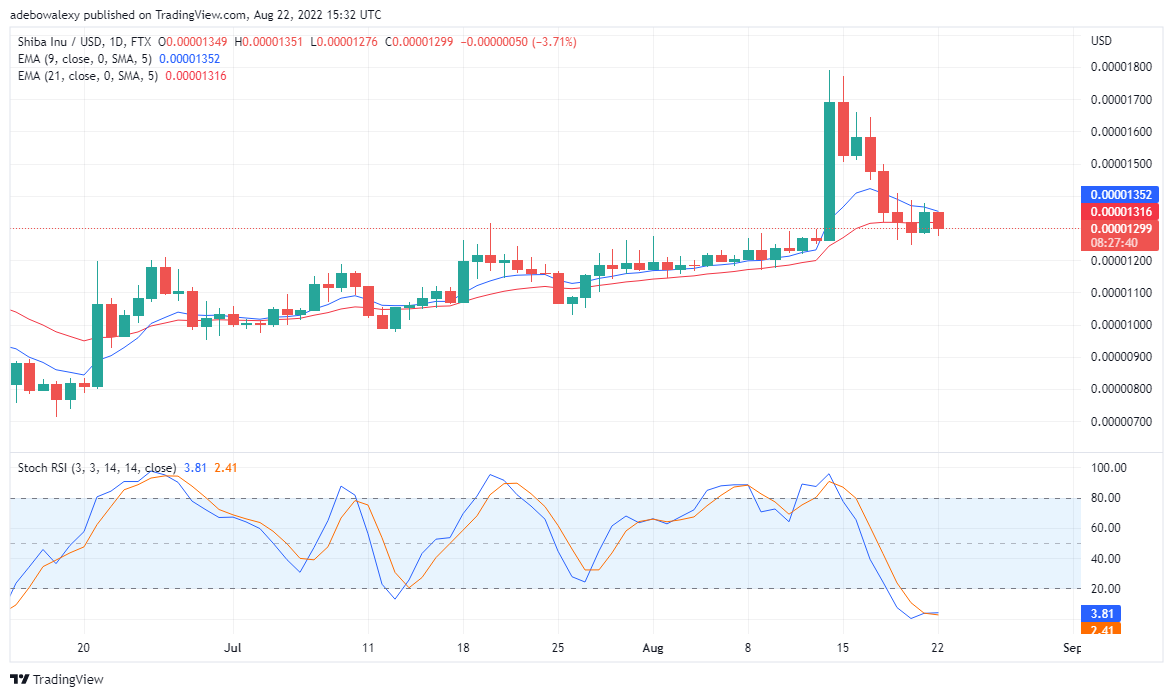
SHIB/USD daily chart shows that Sellers are getting exhausting overtime. It could be observed that following the large spike in Shiba Inu price there have been more selling activities than buying. Even when buyers attempted to correct the price upwards the following candle would favor the sellers. However, now it looks as if a correction is possible as price activity appears to have hit an unbreakable support around $0.00001300.
Also, the Stochastic RSI indicator lines have already arrived at the oversold zone. Subsequently, the lines of the SRSI have crossed, but it looks like more buying activities are needed before the uptrend can gain significant momentum. If buying pressure should keep increasing in this market, prices may increase to near $0.00001550 or $0.00001600. Traders in this market may position a pending buy order around $0.00001352.

Shiba Inu Price Analysis: Is SHIB/USD Hints an Upside Bounce?
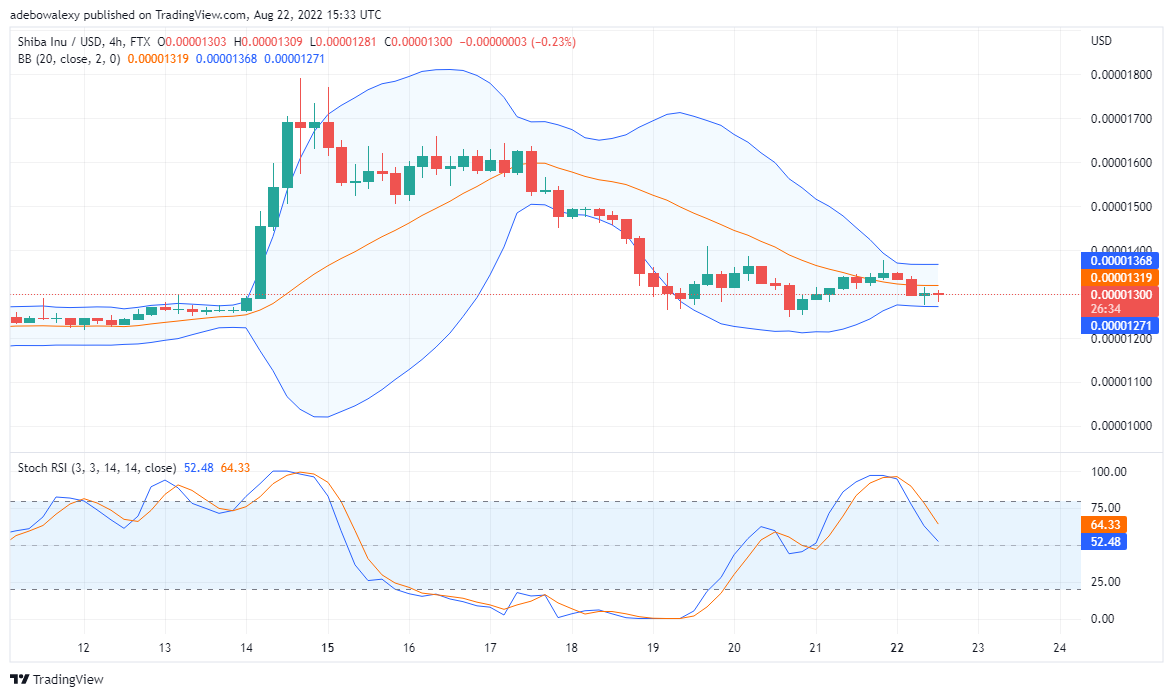
Looking at the four-hour chart, we can perceive signs of an impending upward correction. The Bolinger indicator has become narrow, and the recent price candles are lining up on the lower band of this Indicator. Summing up the positioning of the candle and the behavior of the Bollinger, it can be assumed that an Uptrend will occur soon.
Your capital is at risk.
On the contrary, the RSI indicator is saying otherwise at this point. The display on the RSI indicator for this chart indicates that a further downtrend will be experienced. Therefore, the best move to make in this type of market is to lie in wait to see if buying pressure will resume. As earlier mentioned, one can position a pending buy order in this market.
To contribute to the Tamadoge fundraise, interested parties will need to connect with their crypto wallets, such as MetaMask or Trust Wallet, at buy.tamadoge.io. The TAMA token can be bought with USDT or ETH. Tamadoge runs on the Ethereum blockchain, the No.1 decentralised application computing platform.
Related
Tamadoge – Play to Earn Meme Coin
- Earn TAMA in Battles With Doge Pets
- Capped Supply of 2 Bn, Token Burn
- NFT-Based Metaverse Game
- Presale Live Now – tamadoge.io


