DOGE came under the control of downward forces after it hit a strong resistance level. The price of this crypto has since then been trading at lower prices. Although DOGE has been trading at very minimal gain for some time now, it’s as if signs of recovery are already appearing on its trading chart. Therefore we must examine and understand those signs, to know the right approach to be given to this market.
Dogecoin’s Analysis Statistics Data:
Dogecoin’s 0.06926
Dogecoin’s Market Capitalization: $9.1 billion
Dogecoin’s Moving Supply: 132.7 billion
Dogecoin’s Overall Supply: 132.7 billion
Dogecoin’s Coinmarketcap Ranking: #10
Key Price Marks:
Resistance Levels: $0.06926, $0.07050, $0.07100
Support Levels: $0.06919, $0.06870, $0.06800
In today’s analysis, we will study the signs that could be picked up from this market. We’ll also compare the DOGE against Bitcoin (BTC) to know what improvement DOGE has versus BTC.

DOGE Signs of Recovery, Buy Tama Today
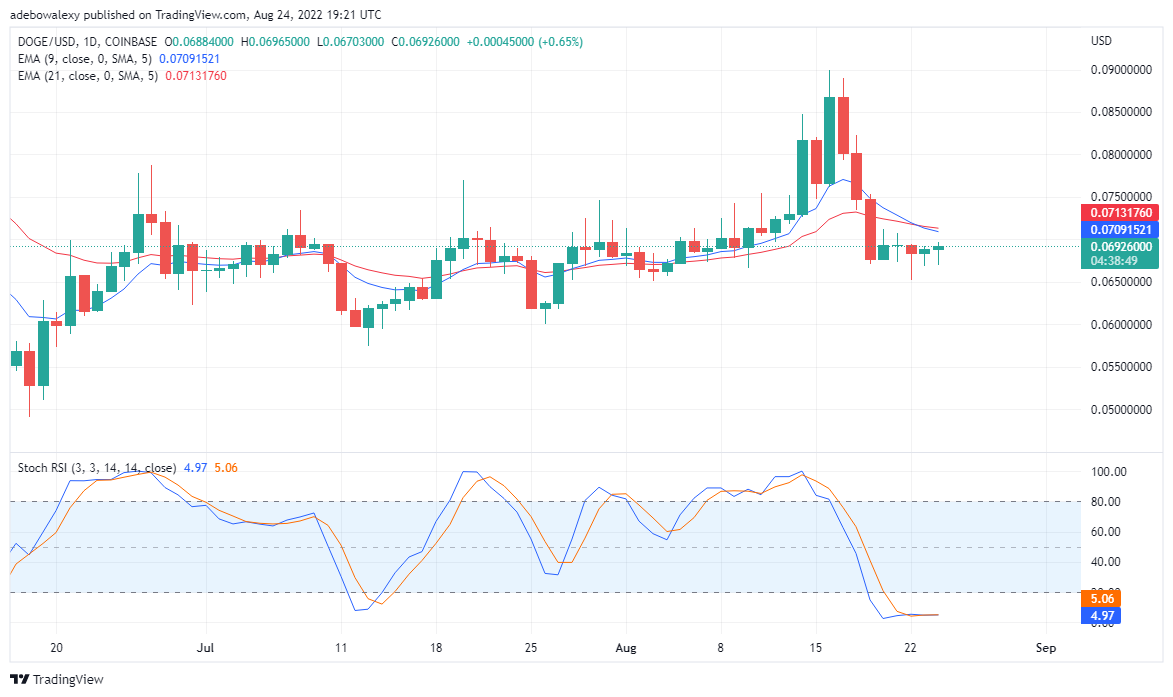
The DOGE/USD 24-hour chart is revealing signs of buyers trying to take over the price action in this market. By closely examining the last two candles on this chart we can perceive the formation of two bullish hammer candlesticks. Also, it could be observed that with the last candle, price action inches closer to the Exponential MA curves. The recent formation of the hammer candlestick on this chart portrays that an upward reversal is near.
Additionally, the RSI curves have reached the oversold zone and have crossed each other. Although it is still moving sideways and remains interwoven. As buyers continue to buy at this level, bullish momentum will continue to build up, and eventually, Dogecoin price will rise. Traders can buy at this level, or place a pending buy order around $0.07092 to catch in early on the developing trend.

Dogecoin Price Analysis: DOGE/BTC in a State of Indecision
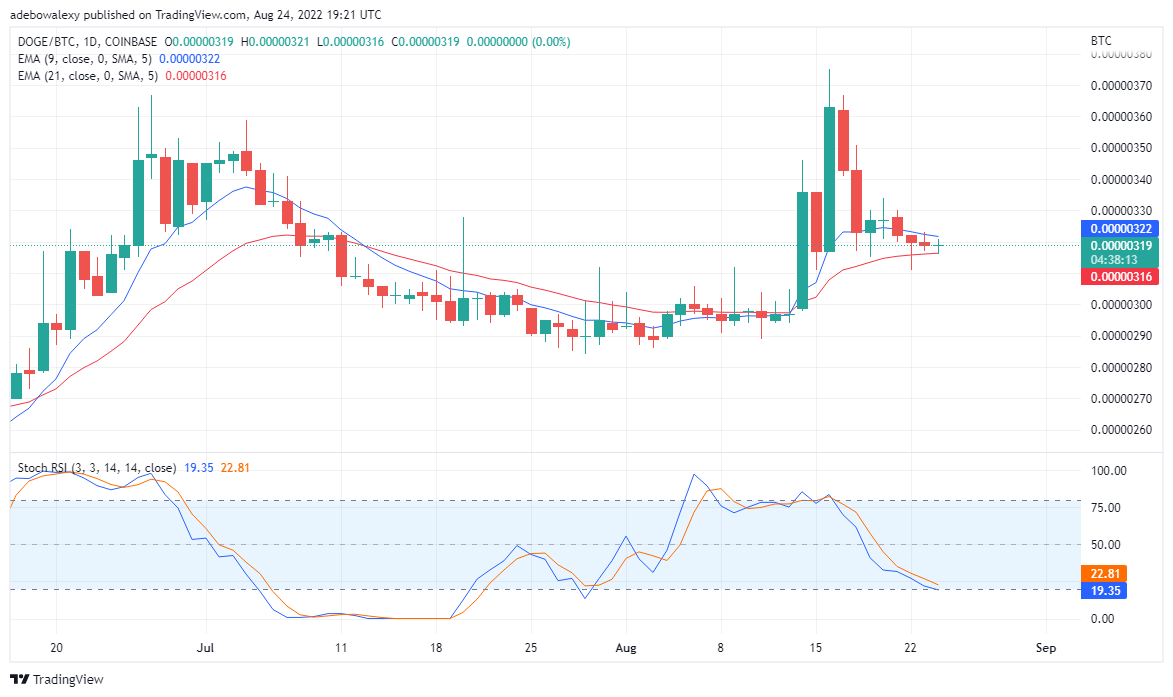
DOGE/BTC daily chart portrays a state of Indecision with the formation of the last bullish candlestick. Interestingly in this market, it can be perceived that price action has been trapped between the 9 and 21 days EMAs. Also, we can see that the last candlestick here is a Doji. Essentially the appearance of this portrays a tight struggle between bulls and bears. Although Buyer eventually won the day but, it was a narrow win. At this point, we may anticipate an upward or downside correction.
Your capital is at risk.
Even the RSI indicator can be seen to still be pointing downwards into the highly sold area. However, the separation between its curves has become narrower. Traders can then lay ambush for an uptrend at 0.00000320.
To contribute to the Tamadoge fundraise, interested parties will need to connect with their crypto wallets, such as MetaMask or Trust Wallet, at buy.tamadoge.io. The TAMA token can be bought with USDT or ETH. Tamadoge runs on the Ethereum blockchain, the No.1 decentralised application computing platform.
Related
Tamadoge – Play to Earn Meme Coin
- Earn TAMA in Battles With Doge Pets
- Capped Supply of 2 Bn, Token Burn
- NFT-Based Metaverse Game
- Presale Live Now – tamadoge.io


