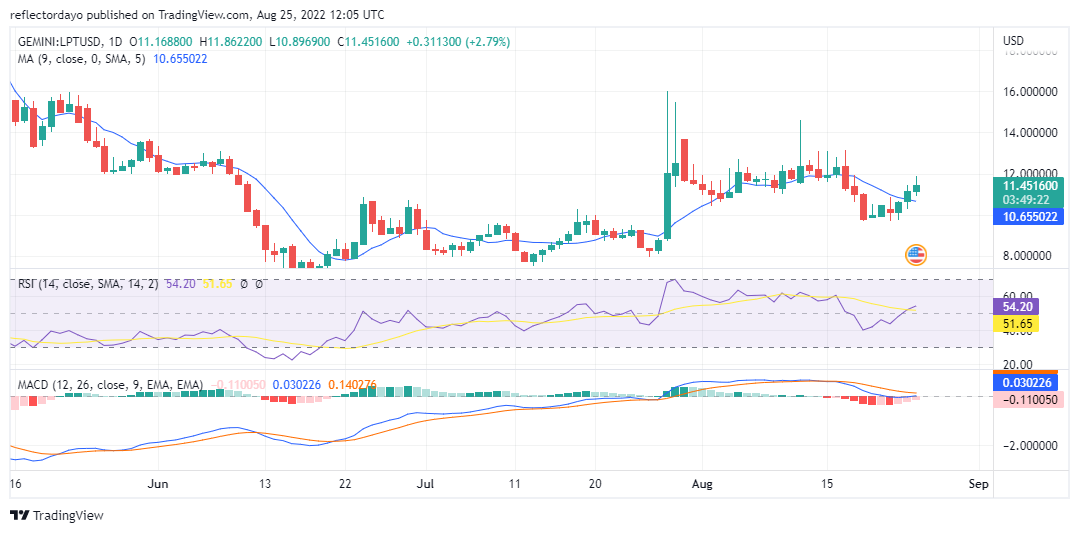
In a response to the strong selling pressure LPT/USD that take place from the 17th to 19th of August, bulls became aggressive enough to regain their ground in the market. However, their strength is waning too soon. Today’s candle shows that the buying pressure is reducing and the selling pressure is increasing. Although bears have not fully taken the market for today, there is a chance that the next trading session may be bearish. In a broad view of the market, we can see that since early JulyJuly the market has swung in a regular pattern. It’s like bears respond in proportion to bulls. On July 28, there was a very strong bullish price action but by The next day, we also see a very bearish price action that was just as strong as the previous day. On the 29th of August, the bearish candlestick opens at a much higher position than the close of the previous day’s bullish candlestick. This type of candlestick pattern indicates strong selling pressure. After this, there was a brief period of price consolidation which lasted from the 5th of August to the 17th of August. Then bears take the price down. From this, the bulls have not been able to recover.
Livepeer Price Statistic:
- Livepeer price now: $11.332400
- Livepeer market cap: $ 277,438,505
- Livepeer circulating supply: 24,484,001.75
- Livepeertotal supply: 25,866,594
- Livepeercoin market ranking: #115
Key Levels
- Resistance: $12.00000, $3.723167, $15.129179
- Support: $10.684366, $9.777261, $8.235181
Your capital is at risk
Livepeer Price Analysis: The Indicators Point of View
In the Relative Strength Index, the faster line has crossed the slower line. This supposes to signal that price actions are swinging to the upside. But the behaviour of today’s candlestick may be indicating that the trend is weakening and that it may soon swing low to favour sellers despite the indication of the RSI. From the Moving Average Convergence and Divergence (MACD), we can see that the bearish momentum is reducing. The later pink histograms, instead of red ones, indicate that the price is recovering from the bearish side. The two lines of the MACD have not crossed each other, but they are coming close. And the bearish histogram is closer to the point zero with just a difference of -0.110050

Livepeer Price Analysis: LPT/USD 4-Hour Chart Outlook
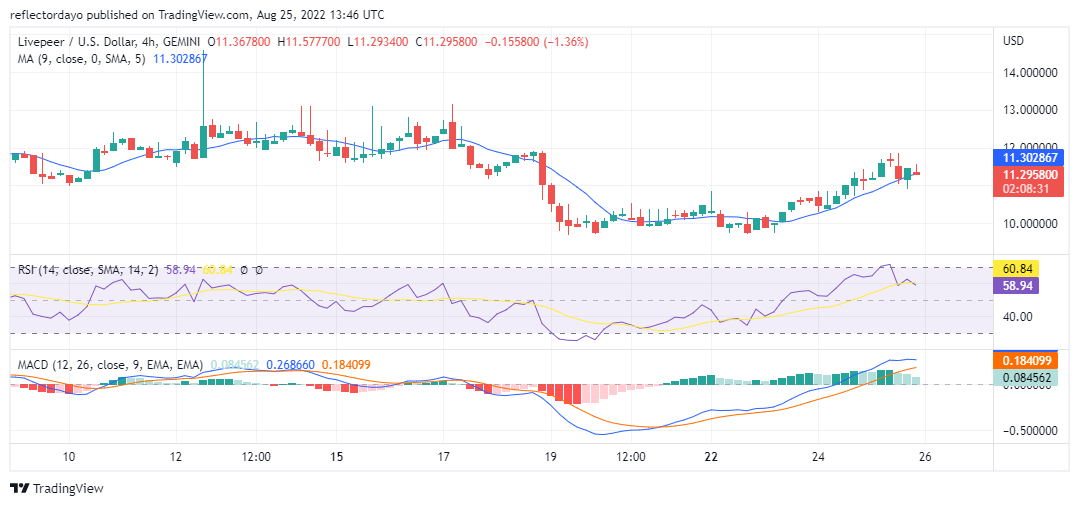
As we scale into the 4-hour chart timeframe, we can see that today’s market is indeed bullish. Bulls appear to be recovering their ground in the market. In the 8 o clock (morning session) bears aggressively attempted to take that session but bears stopped them. The candle for that session opened far above the closing of the bullish candle. That is a sign of a strong attempt to push down the price. In the MACD indicator, the faded greenish short candle shows that the buying pressure is waning. There is a possibility that the price might change side again. The price of LPT/USD might linger at around $11.0000
Related
Tamadoge – Play to Earn Meme Coin
- Earn TAMA in Battles With Doge Pets
- Capped Supply of 2 Bn, Token Burn
- NFT-Based Metaverse Game
- Presale Live Now – tamadoge.io


