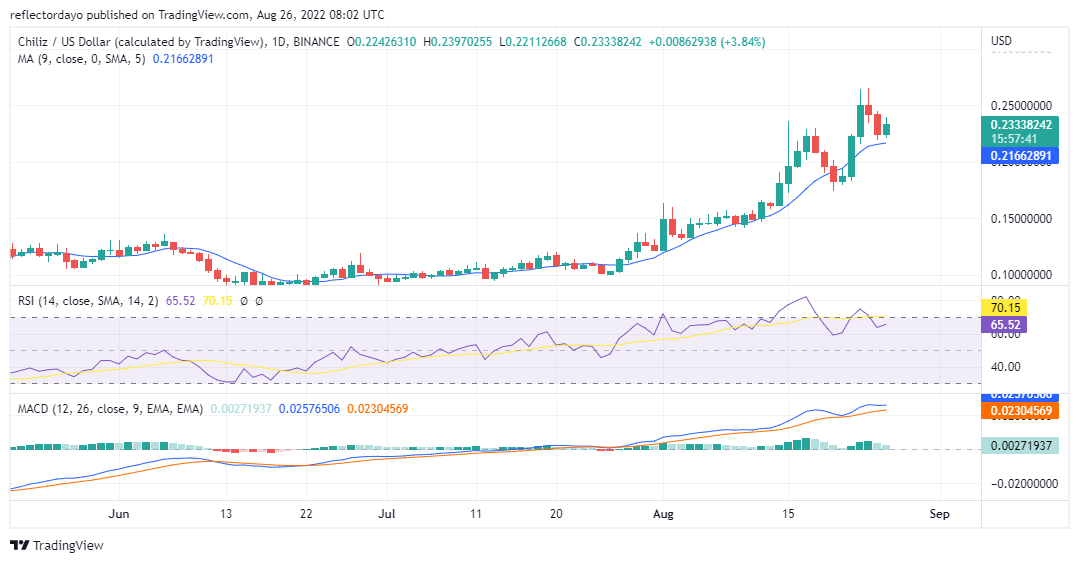
CHZ/USD has been in an uptrend since July 26th, the market breaks out of a long-term consolidation period from the middle of June. Along the line of the uptrend, strong selling pressure can be seen to have affected some of the outlook of candlesticks in the uptrend chart. On the 18th of August, the market began to trend down for three consecutive days. This only turned out just to be a bullish recess. The buying pressure resumed again on the 22nd of August with full force touching the $0.2500000 resistance level. This strong move was also followed by another bullish recess. Bearish pressure on the 24th and 25th is not so strong as to push the price action lower than the $0.22372877 support level. For today’s market session, the Bulls are at it again, taking the market with a 2.7% gain.
Chiliz Price Statistic:
- CHZ/USD price now: $0.2327
- CHZ/USD market cap: $ 1,395,556,031
- CHZ/USD circulating supply: 6.00B CHZ
- CHZ/USD total supply: 8,888,888,888
- CHZ/USD coin market ranking: #41
Key Levels
- Resistance: $0.24230359, $0.25114875, $0.26618551
- Support: $0.18216655, $0.18269722, $0.14500691
Your capital is at risk
Chiliz Price Analysis: The Indicators Point of View
According to the Relative Strength Index, the Chiliz market is very bullish. RSI indicator line is reading its measurement at around 70%. And this line has been moving around this area for almost a month now. At some point, the line goes into the overbought zone of the RSI. And in response to this line action, the price retraces lower levels. After this, bullish activities resume again. As we can see on the chart, after the market went in favour of bears yesterday, the buying pressure in the market today is fairly strong. And since price action crosses the 9-day moving average on the 22nd of August, it had remained above it. This is an indication that the buying pressure is still strong. However, on the MACD indicator, the faded greenish histogram is an indication that the buying pressure is weakening. But, if we look closely we can see that the Histogram is correcting itself to the current price behaviour as the gap between the histogram and the point zero is widening up to support the views of the other indicators.

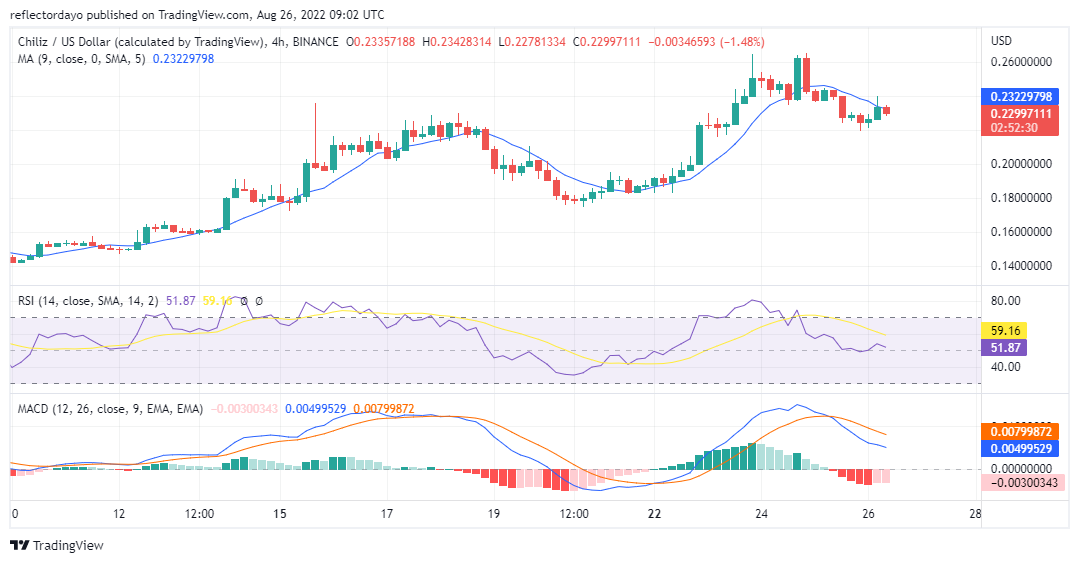
Chiliz Price Analysis: CHZ/USD 4-Hour Chart Outlook
In this shorter timeframe, here we see a very flat bearish candlestick on the third session of the day. Such candlestick signifies a serious contest between demand and supply. Here in this shorter timeframe, indicators are pointing to a downtrend. The price actions are below the 9-day
moving average, the RSI line is at the midpoint of around 50% and the MACD histogram is below the zero point. All this are indicating a market in favour of bears. Yet, from the indicators, there are signs of recovery. The MACD histograms are pinkish to signify the recovery of the price from the downside. The price action may likely retrace $0.2400000 resistance level soon
Related
Tamadoge – Play to Earn Meme Coin
- Earn TAMA in Battles With Doge Pets
- Capped Supply of 2 Bn, Token Burn
- NFT-Based Metaverse Game
- Presale Live Now – tamadoge.io


