The sellers are dominating Solana market
Solana Price Analysis – August 28
Solana may break down $31 support level in which $28 and $25 price levels may be reached. In case the $31 level holds, the price may increase to the resistance levels at $34, $38 and $39.
SOL/USD Market
Key Levels:
Resistance levels: $34, $38, $39
Support levels: $31, $28, $25
SOL/USD Long-term Trend: Bearish
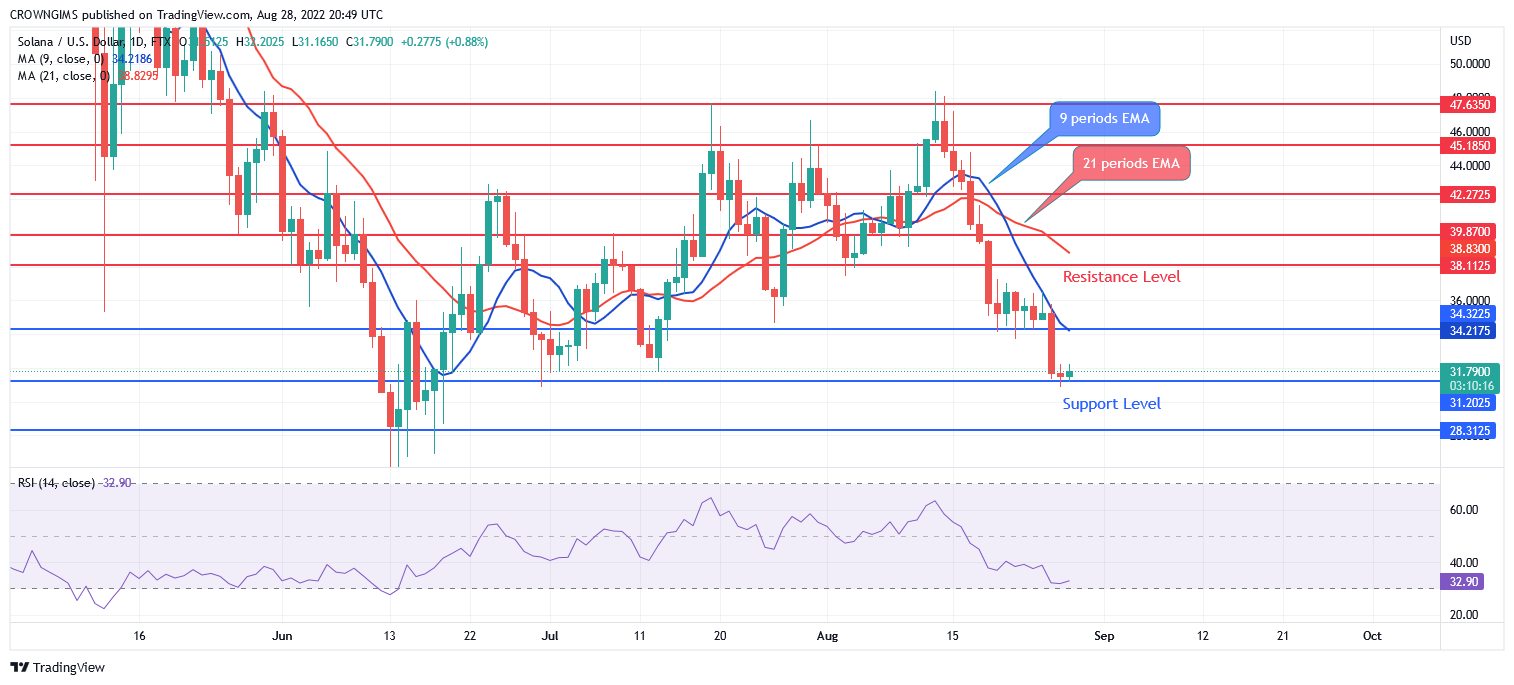
Solana is on bearish movement on the daily chart. There was a consolidation movement last last week when price reached the support level of $34. On August 26, the sellers’ pressure increased with the formation of strong bearish candle which penetrate the $34 level downside. Solana price decreases to the $31 support level. More pressure from sellers may decline price to $28 level.

Sellers are dominating the market as the price crossed downside the 9 periods EMA and 21 periods EMA. The former EMA has crossed the later which confirms the bearish trend. The price may break down $31 support level in which $28 and $25 price levels may be reached. In case the $31 level holds, the price may increase to the resistance levels at $34, $38 and $39. Meanwhile, the relative strength index period 14 is at 33 levels displaying bearish direction.
SOL/USD Medium-term Trend: Bearish, TAMA to Pump Furiously
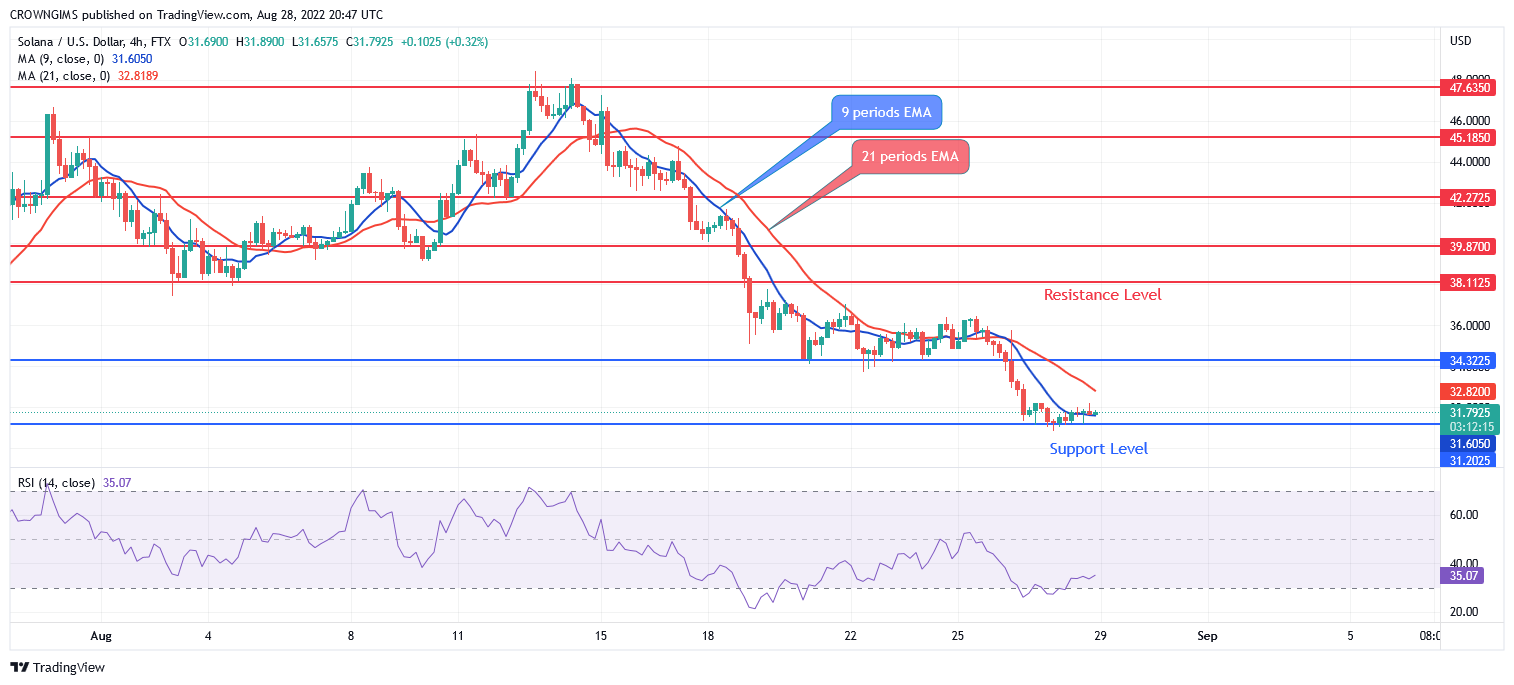
Solana’s performance has been bearish in the medium-term outlook. After the consolidation at $34 level last week, pressure from the sellers of Solana has pushed the price to $31 price level. The price is under the control of the sellers. It seems the bears’ pressure is getting weak and the price is consolidating at the moment.

Further push by the Bears may bring the coin to the low level at $28. The Relative Strength Index period 14 is at the 35 levels and the signal line pointing up to indicate the buy signal which may be a pullback.


