The bulls dominate MATIC market
Polygon (MATICUSD) Price Analysis – September 02
In case the buyers increase their pressure or maintaining their current momentum, $0.9 price level may be broken upside and resistance levels of $1.0 and $1.1 may be tested. If the bears defend the resistance level of $0.9, MATIC may reverse and continue a bearish trend to $0.7, $0.6 and $0.4 levels.
Key Levels:
Resistance levels: $0.9, $1.0, $1.1
Support levels: $0.7, $0.6, $0.4
MATIC/USD Long-term Trend: Bullish
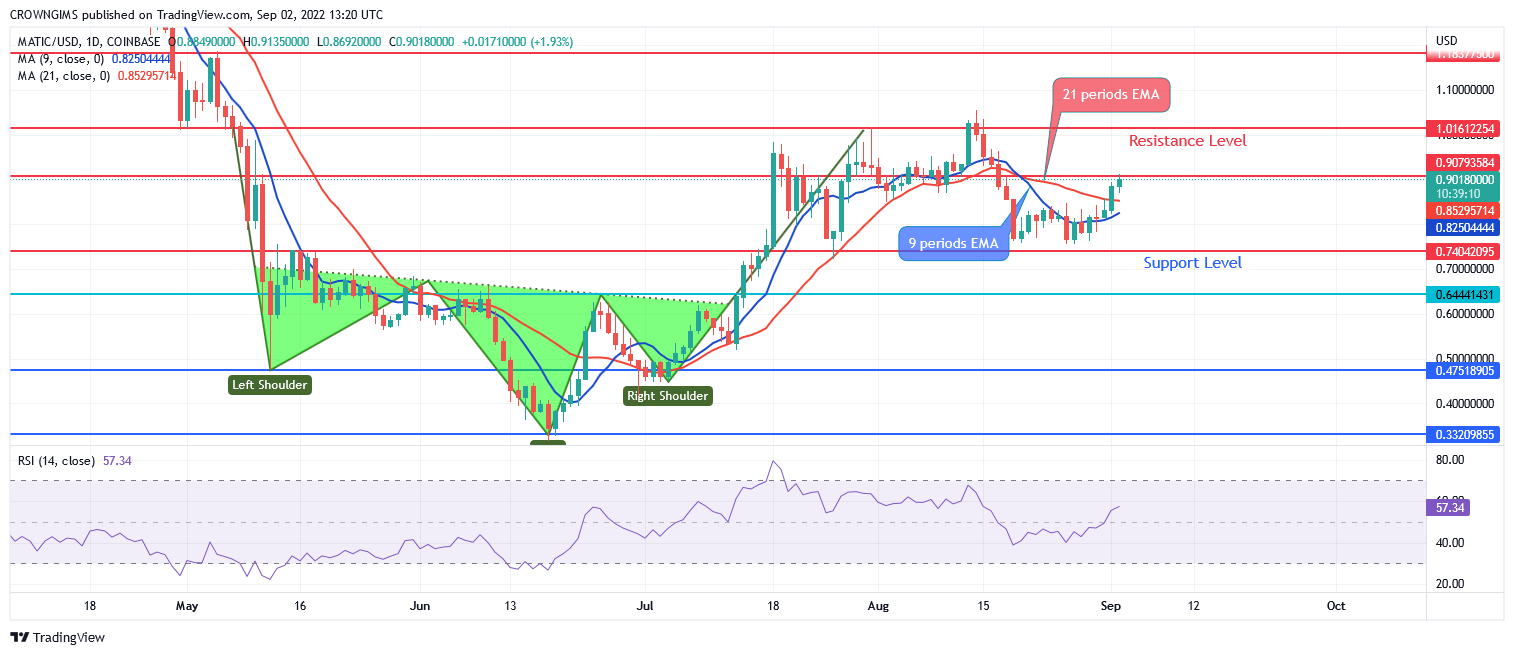
MATIC/USD price is on the bullish movement on the Long-term outlook. The bears were in control of the Polygon market last week. The bearish trend pushed down the price and found support at $0.7, the price pulled back and break up the dynamic resistance levels. It is heading towards the resistance level of $0.9. An increase in the buyers’ momentum may break up the resistance level of $0.9.

Further increase in the Polygon price is highly envisaged, in case the buyers increase their pressure or maintaining their current momentum, $0.9 price level may be broken upside and resistance levels of $1.0 and $1.1 may be tested. If the bears defend the resistance level of $0.9, the price may reverse and continue a bearish trend to $0.7, $0.6 and $0.4 levels.
MATIC/USD Short-term Trend: Bullish, TAMA Heads Toward North
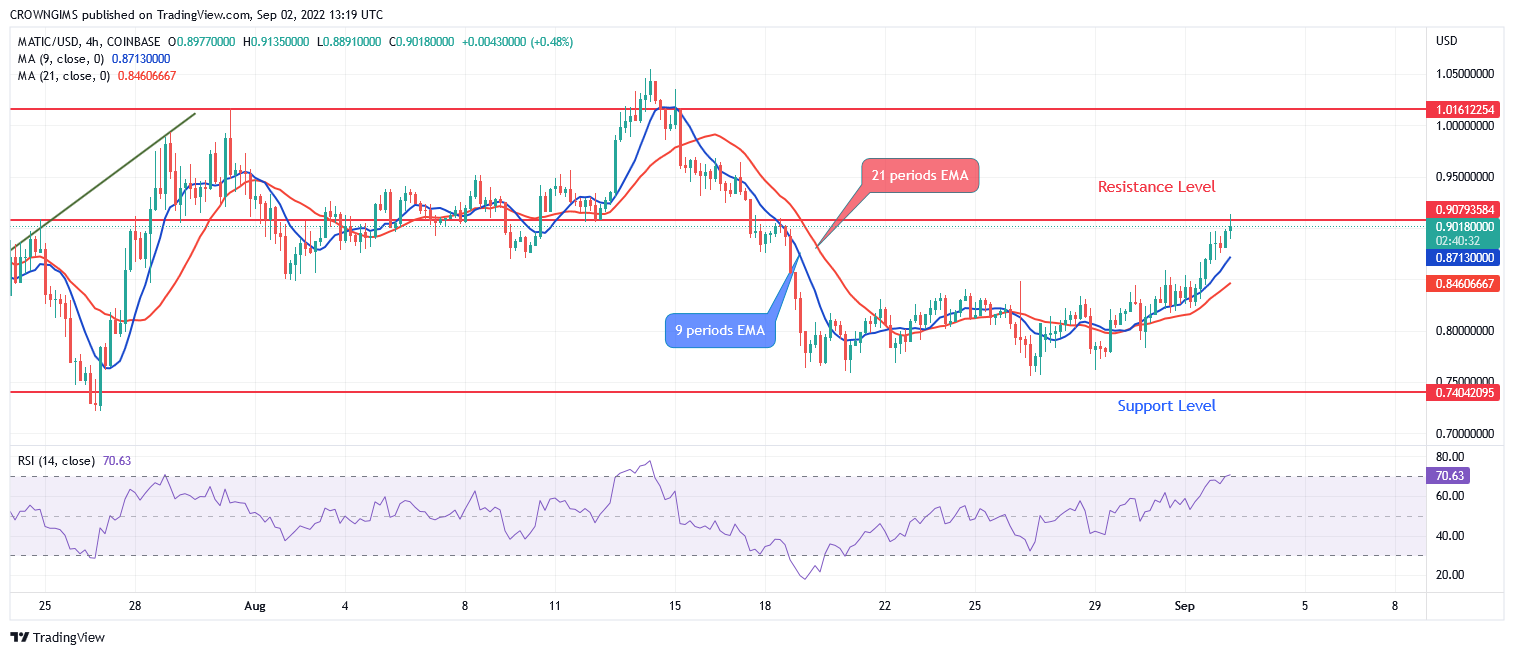
Polygon is bullish on the medium-term outlook. The price declines from the high of $1.0 to $0.7 level after it broke down the support level of $0.9. Buyers prevented further bearish trend at the $0.7 level. More strength was gained by the bulls and the price increase above the dynamic resistance levels. MATIC is currently testing $0.9 level.

The 9-day EMA is above the 21 periods EMA and the Polygon price is trading above the two EMAs with the distance between them which indicates a strong bullish trend. The relative strength index period 14 is at 69 levels with the signal line pointing up to connote buy signal.


