AVAX under sellers’ control
Avalanche (AVAXUSD) Price Analysis – September 15
Currently, the key resistance level to watch out for lies at $21, $29 and $37. A downward movement may take the AVAX to $17 and a bearish breakout at the mentioned support level will expose the coin to the support level of $10 and $6.
AVAX/USD Market
Key Levels:
Resistance levels: $21, $29, $37
Support levels: $17, $10, $6
AVAX/USD Long-term Trend: Bearish
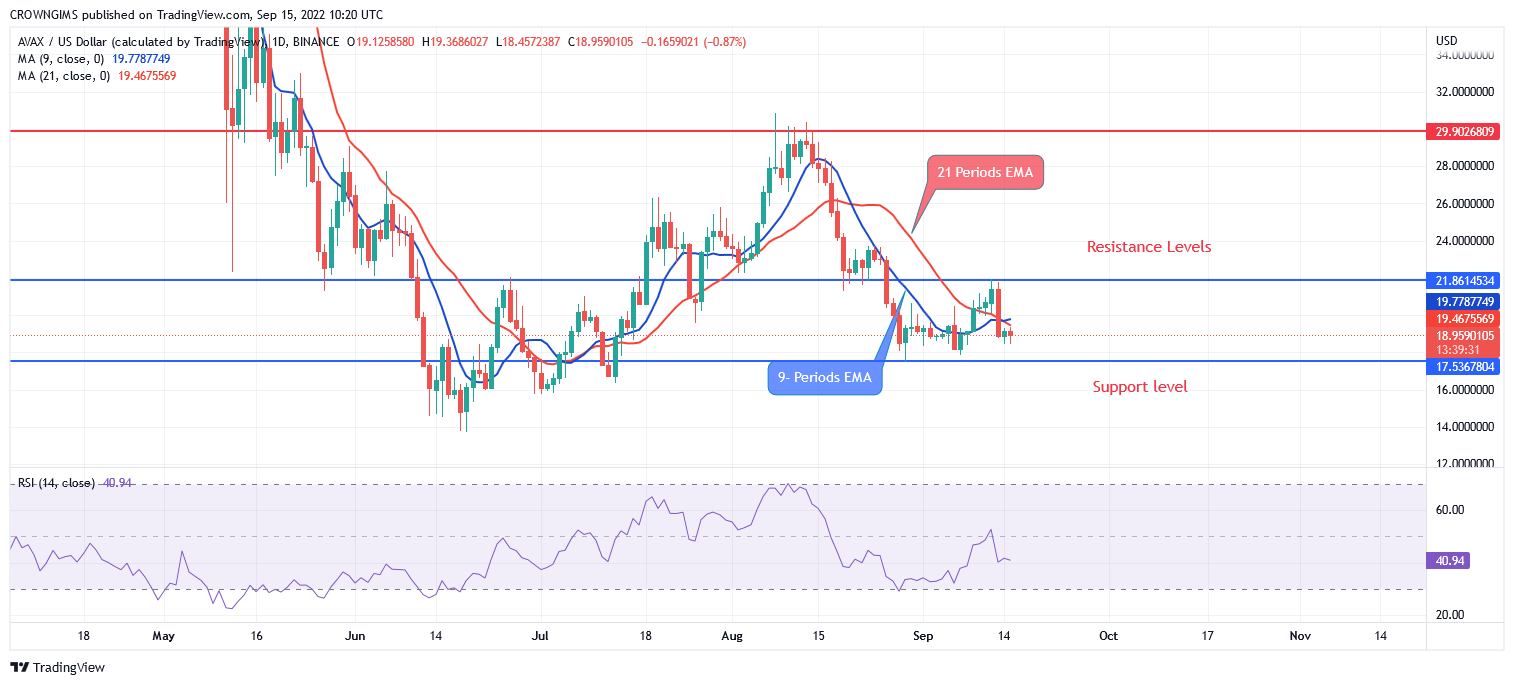
Avalanche is under bears’ control. The coin is forming a double bottom chart pattern; this is a bullish chart pattern and the price is yet to obey the command. A bearish trend started on August 14 in the Avalanche market; it is clearly displayed when the bullish candle could not break up the resistance level of $29. More bearish candles continue to emerge and the price declined towards the $17 support level. At the moment the price is ranging within$21and $17 levels.

On the daily chart, sellers are dominating the market. The price action is trying to break down the support level of $17. Currently, the key resistance level to watch out for lies at $21, $29 and $37. A downward movement may take the price to $17 and a bearish breakout at the mentioned support level will expose the coin to the support level of $10 and $6. The Relative Strength Index (14) is moving towards the 40 levels, indicating a further downward movement.
AVAX/USD Medium-term Trend: Bearish, TAMA Presale Hits $16 Million
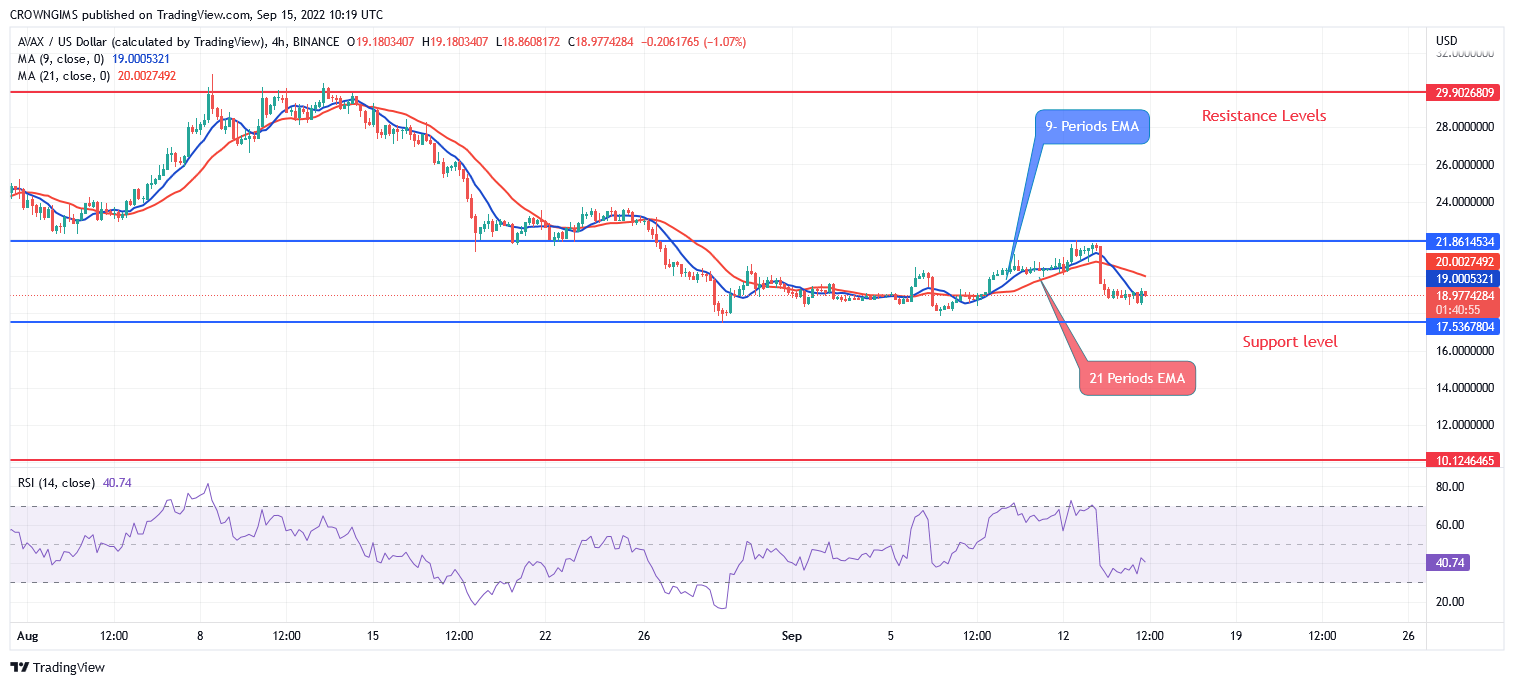
Avalanche performance has been very bearish in the 4 hour chart; this may be due to a persistence pressure from the sellers of Avalanche. In other words, the price actions remain in a downward trend for many days ago. The market is moving lower and this may continue unless the support level at $17 holds.

The price is trading below 9 periods EMA and 21 periods EMA as an indication that the bears are in control. The Relative Strength Index period (14) is at 40 levels and the signal line pointing down to indicate a sell signal.


