Litecoin Suffers Slow Precipitations – September 19
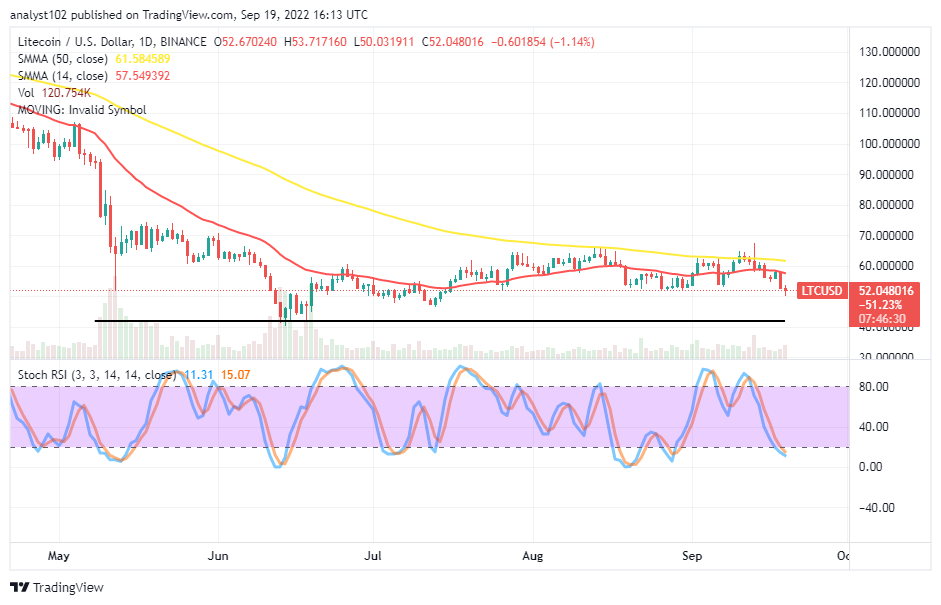
Recently, the consolidation moving mode of the LTC/USD market has paved for a situation that makes the crypto drops to the $50 line. In the last thirty days’ trading operations, the price has traded between the low and the high values of $50.43 and %67.07. There is a negative percentage rate of 1.14 as of the time of writing.
Litecoin (LTC) Statistics:
LTC price now – $52.08
LTC market cap – $3.7 billion
LTC circulating supply – 71.2 million
LTC total supply – 84 million
Coinmarketcap ranking – #22
LTC Suffers Slow Precipitations
Key Levels:
Resistance levels: $60, $70, $80
Support levels: $45, $40, $35 LTC/USD – Daily Chart
The daily chart showcases the LTC/USD market activity drops to the $50 level because buyers lacked the energy to move through the value resistances of the SMAs. The 14-day SMA indicator is at $57.549392 below the $61.584589 value line of the 50-day SMA indicator. The horizontal line remains drawn at the $42 support level. The Stochastic Oscillators have penetrated the oversold region to touch the range values of 15.07 and 11.31. It appears the downward force is somewhat in progress.
Your capital is at risk.
Under what conditions can the LTC/USD market drop further past the $50 level?
One of the trading conditions that can lead to letting the LTC/USD market drop further past the $50 level is seeing bears’ consolidating their presence around the value line for a long time as the crypto drops to the point today. A 1-hour or 4-hour bullish candlestick at a lower-trading zone may grant buyers a better stance to hedge against free fall-offs from around the value point. Therefore, it would be in the best interest of long-position takers to stay alerted while that presumption materializes afterward.
On the downside of the technical analysis, most trading indicators still suggest that the LTC/USD trade is under a depression fast approaching a lower-trading spot of exhaustion. If the market has to revisit the lower previous low around the $40 level, the motion style will be serially coming forth with some variant lower lows. By then, dicey moments will dominate the trading arena regarding placing a selling order.
LTC/BTC Price Analysis
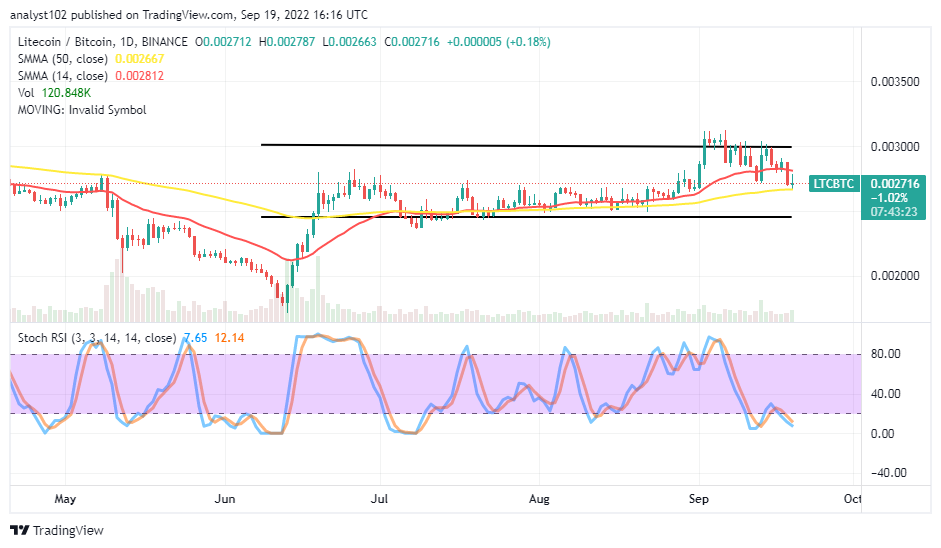
Litecoin’s trending capability against Bitcoin remains trading in higher range-bound zones over a couple of sessions. The cryptocurrency pair price drops to the bigger SMA from the upper range line drawn. The 14-day SMA is above the 50-day SMA indicator. The Stochastic Oscillators have dipped into the oversold region. And they are pointing toward the south within it at the range points of 12.14 and 7.65. That shows the pairing crypto market may still experience further debases for a while before making an upward swing afterward.
Tamadoge – Play to Earn Meme Coin
- Earn TAMA in Battles With Doge Pets
- Capped Supply of 2 Bn, Token Burn
- Presale Raised $19 Million in Two Months
- Upcoming ICO on LBank, Uniswap
Read more:


