Ethereum Bulls are too tired to cause any significant price increase in the ETH/USD market. Also, technical indicators as well portray less vigor in price activity.
Ethereum Analysis Statistics Data:
Ethereum’s value now: $$1320.70
ETH’s market cap: $162.97 billion
ETH’s moving supply: 122.54 million
The Total supply of Ethereum’s: 122.54 billion
ETH’s Coinmarketcap ranking: #2
This calls for a critical examination of this market, to determine the best actions to take in this market. This price speculation will as well cover the ETH/BTC market, to gain useful insights into the market.
Crucial Price Marks:
Top Marks: $1321, $1380, $1420
Base Marks: $1300, $1280, $1250

Bulls in Ethereum Market Are Weak, TAMA Debuts on OKX
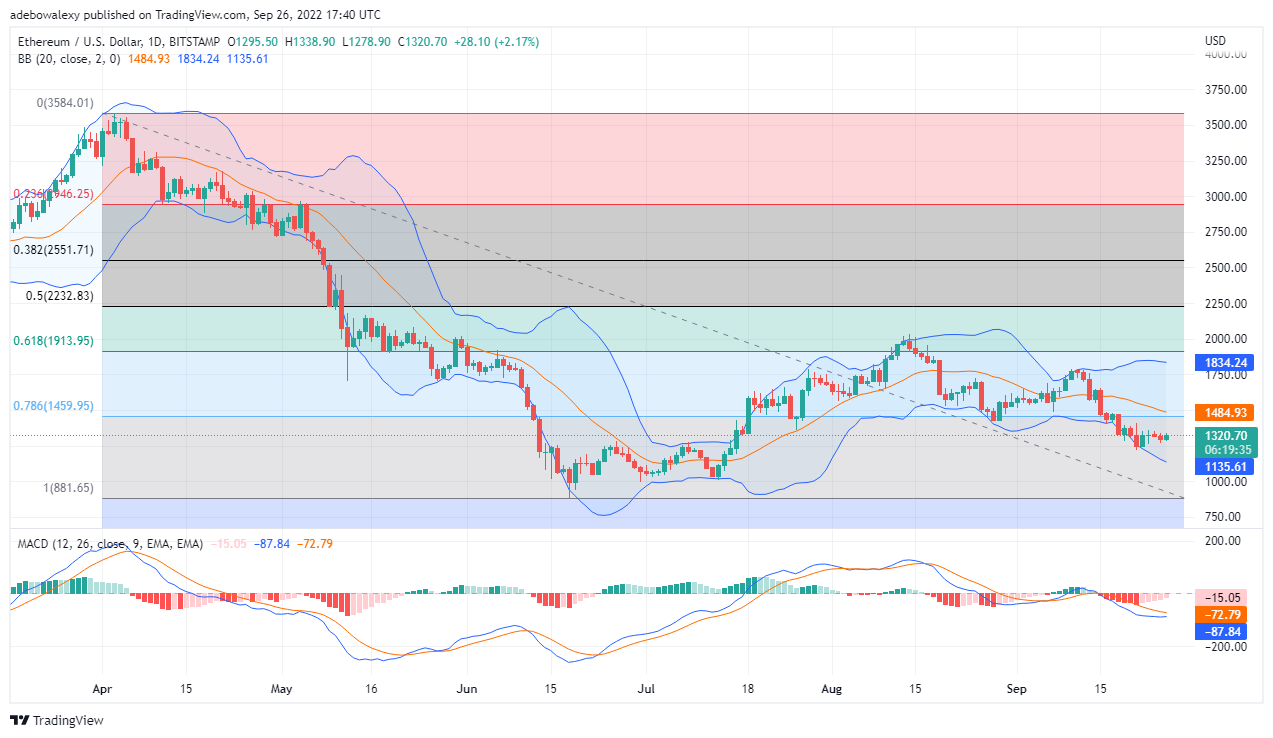
On the ETH/USD daily chart, price action shows a serious lack of momentum towards rising higher. Since the 5th of this month, price activity broke the MA line to the downside, and has remained there till now. The last green candle here – which portrays a price upward move, was unable to surpass the level of the one formed three sessions ago. Also, price movement remains under the MA, and is yet to test the resistance formed by the $1,460 price level. Furthermore, the MACD is pointing sideways under the 0.00 level, as the faster line seems to weakly turn towards the slower one. Consequently, this points to a lack of direction in the trend. Price may attain the $1400 soon, but the possibility of it reaching higher above isn’t that vivid.

Ethereum Price Speculation: ETH/BTC Bounces of the 50% Fib Level
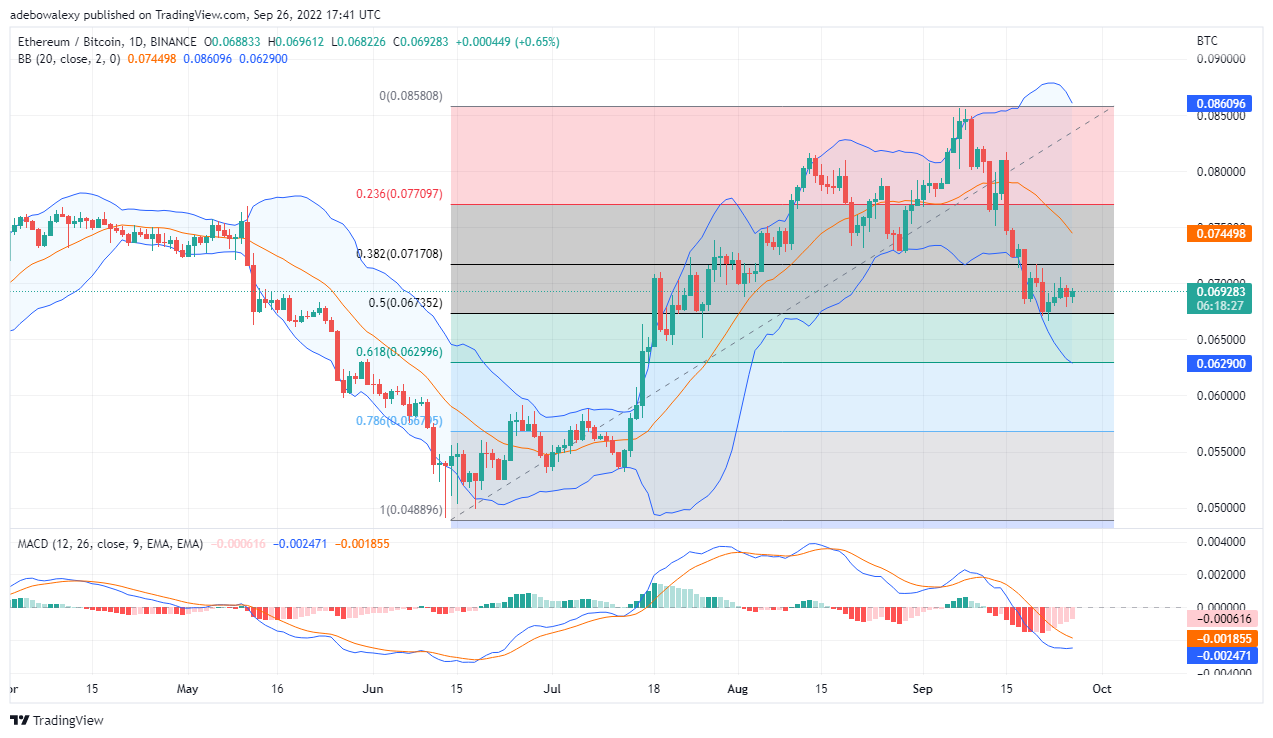
Price action in the ETH/BTC market has corrected off a major Fibonacci support of 50%. This bounce also aligns with the bounce off the lower limit of the Bollinger indicator. However, it appears that this market could use some more upward thrust from the bulls if it must climb higher from here. Else the downtrend may resume and this bounce may only be a minor pullback before the long-term downtrend resumes.
Your capital is at risk.
Furthermore, the MACD indicator appears to be pointing to a possible continuation of the bounce to the upside. This can be seen as the leading line of this indicator could be seen correcting towards the lagging one. Should the two lines eventually converge, then this will indicate that the upside bounce will progress. Nevertheless, the space between the two lines is still significant and additional selling pressure could cause it to diverge as the downtrend continues. Traders can anticipate the value to reach above the 0.07000 level.
.In other altcoin news Tamadoge, a deflationary meme coin and ERC-20 token, will have its initial coin offering (IDO) on OKX. TAMA is set to list at $0.03 on Sept 27th.”
Tamadoge – Play to Earn Meme Coin
- Earn TAMA in Battles With Doge Pets
- Capped Supply of 2 Bn, Token Burn
- Presale Raised $19 Million in Under Two Months
- Upcoming ICO on OKX Exchange


