Bulls dominate Polygon market
Polygon (MATICUSD) Price Analysis – October 07
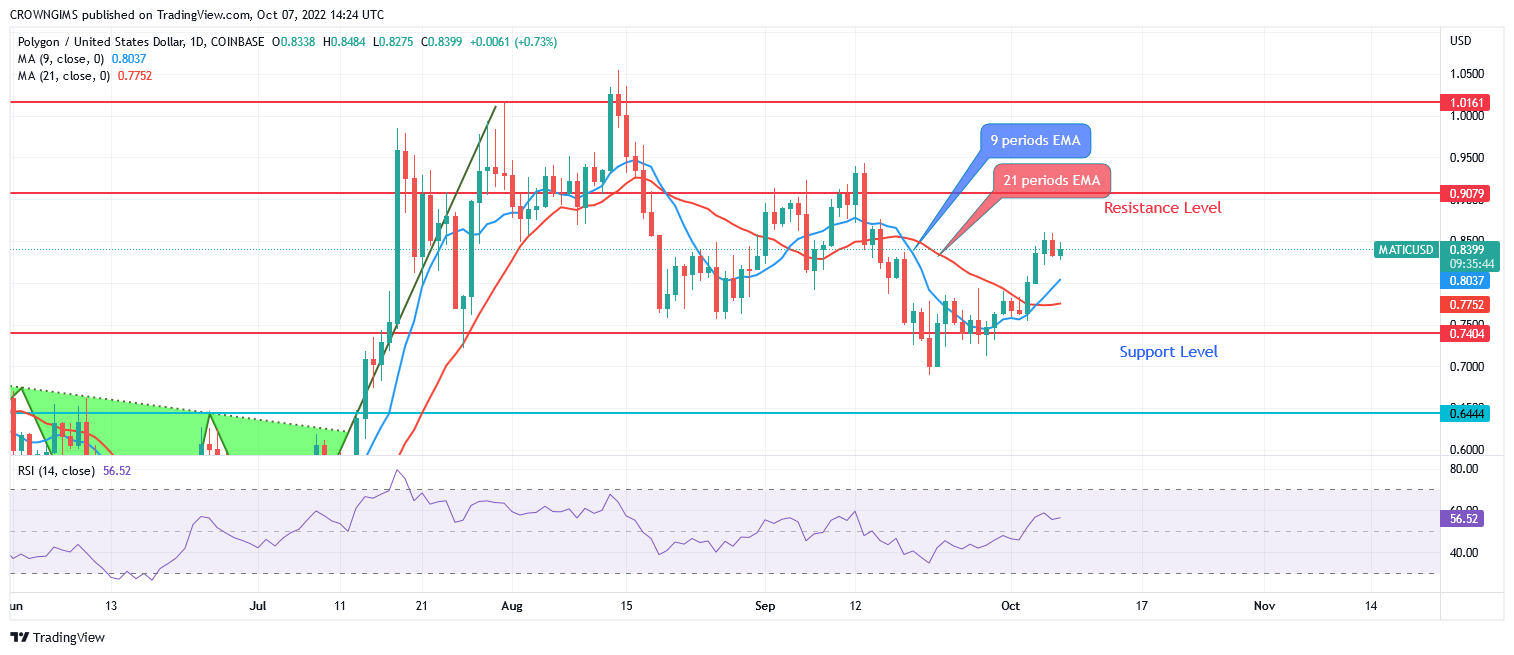
More pressure from buyers will break up the resistance level of $0.90, this may increase the price to $1.01 and $1.18 resistance levels. In case sellers acquire more pressure, Polygon price may reduce to the support level of $0.74 and the support level of $0.64.
Key Levels:
Resistance levels: $0.90, $1.01, $1.18
Support levels: $0.74, $0.64, $0.47
MATIC/USD Long-term Trend: Bullish
On the Long-term outlook, MATIC/USD price is on the bullish trend. The coin was on the bearish trend last week. Sellers took over the market on September 13 at $0.90 resistance level with the formation of bearish engulfing candle. MATIC decreased below $0.74 support level. Bulls gained more momentum and returns price towards previous high at $0.90 level. At the moment bulls are actively controlling polygon market.

Polygon is trading above the 9 periods EMA and 21 periods EMA with the later above former. More pressure from buyers will break up the resistance level of $0.90, this may increase the price to $1.01 and $1.18 resistance levels. In case sellers acquire more pressure, MATIC price may reduce to the support level of $0.74 and the support level of $0.64.
Your capital is at risk
MATIC/USD Short-term Trend: Bullish
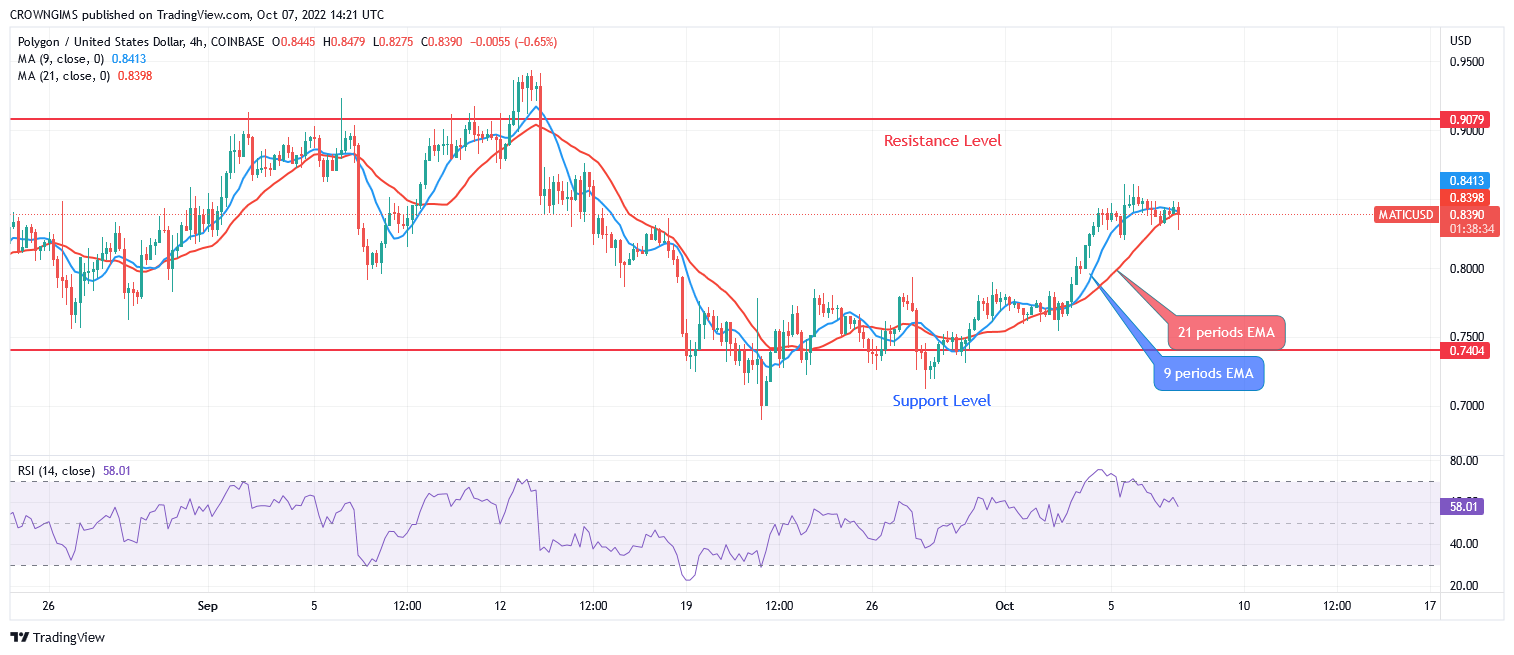
Polygon is bullish on the medium-term outlook. Sellers were able to push the price to the support level of $0.74. Bulls successfully defended the just mentioned support level. MATIC price increases with the formation of more bullish candles. Price is increasing towards the resistance level of $0.90.

The Polygon price is trading above the two EMAs with close distance between them which indicates a bullish trend. The 9-day EMA is above the 21 periods EMA. The relative strength index period 14 is at 59 levels with the signal line pointing down to connote sell signal.
Tamadoge – Play to Earn Meme Coin
- Earn TAMA in Battles With Doge Pets
- Maximum Supply of 2 Bn, Token Burn
- Now Listed on OKX, Bitmart, Uniswap
- Upcoming Listings on LBank, MEXC


