BNB/USD price action has maintained a moderate long-term gain. This moderate upside gain can be observed to have started around the 22nd of last month. Currently, we are at the point of knowing if this upward-sloping trend will be broken down or not.
Binance’s Analysis Statistics Data:
BNB’s value now: $282.2
Binance’s market cap: $45.45 billion
BNB’s moving supply: 161.3 million
Total supply of BNB: 161.3 million
Binance’s Coinmarketcap ranking: #5
To this effect, we shall further examine the BNB/USD and BNB/BTC market with the aid of technical indicators. This will be done to derive beneficial trading decisions.
Important Price Levels:
Top Levels: $290.0, $300, $320
Bottom Levels: $282.2, $270.0, $250.0

Binance Coin Price Prediction Today October 9, 2022: BNB/USD Retraces to the Downside
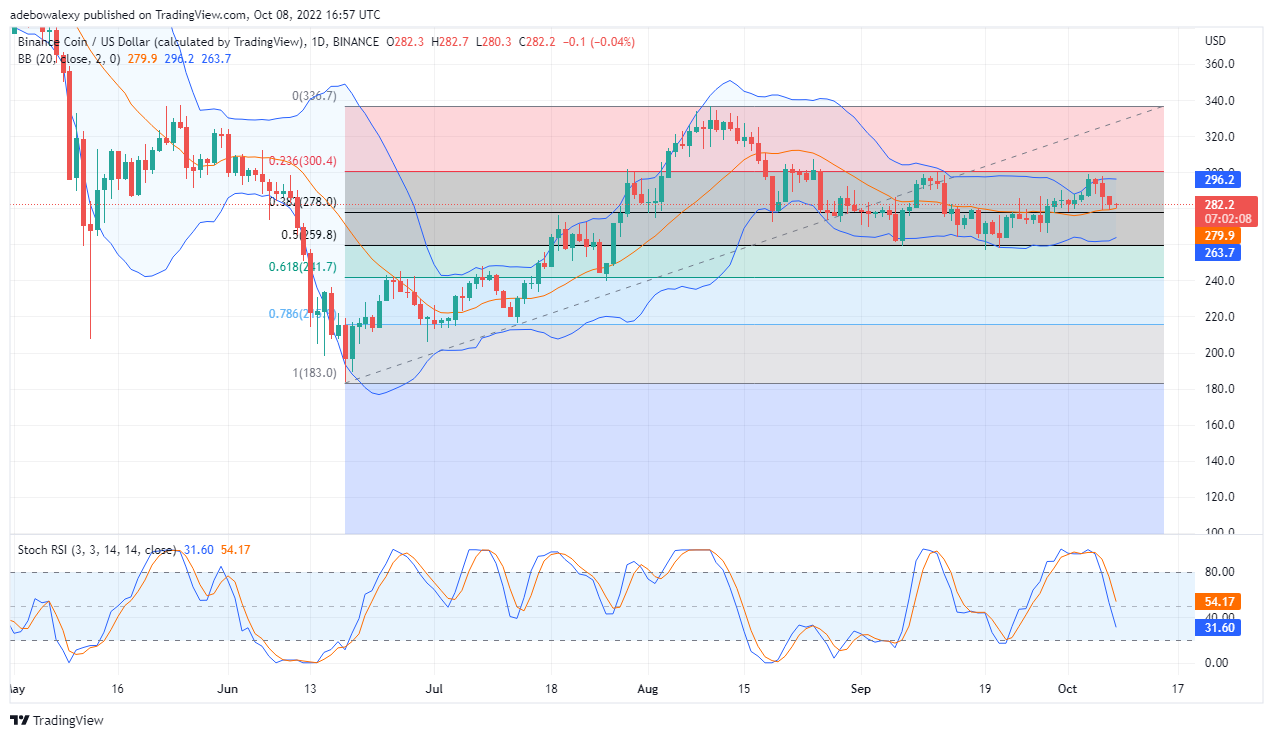
Price action on the BNB/USD market has managed to record moderate profits, since around the 22nd of last month till now. However, since the 4th of October, after price action hit the upper band of the Bollinger, price movement has been on a downside pullback. The question of if this downward rebound will remain as a minor pullback or not depends on the outcome of the current trading session. Moving on, price action remains above the MA of the Bollinger, which hints that the price can still reach higher from here.
Additionally, the Fibonacci level 38.20 is yet to be tested. If eventually, a significant number of traders have anticipated this level as a potential buy point, Binance price candle will find strong support here and will move upwards from there. Nevertheless, the RSI is racing for the oversold, which indicates that the downtrend will continue toward $280 or lower. Consequently, entering traders can position a long order just above the last candlestick here. This will ensure catching the trend earlier should an uptrend occurs at the fib level of 38.20.

Binance Price Prediction Today October 9, 2022: BNB/BTC May Continue Uptrend
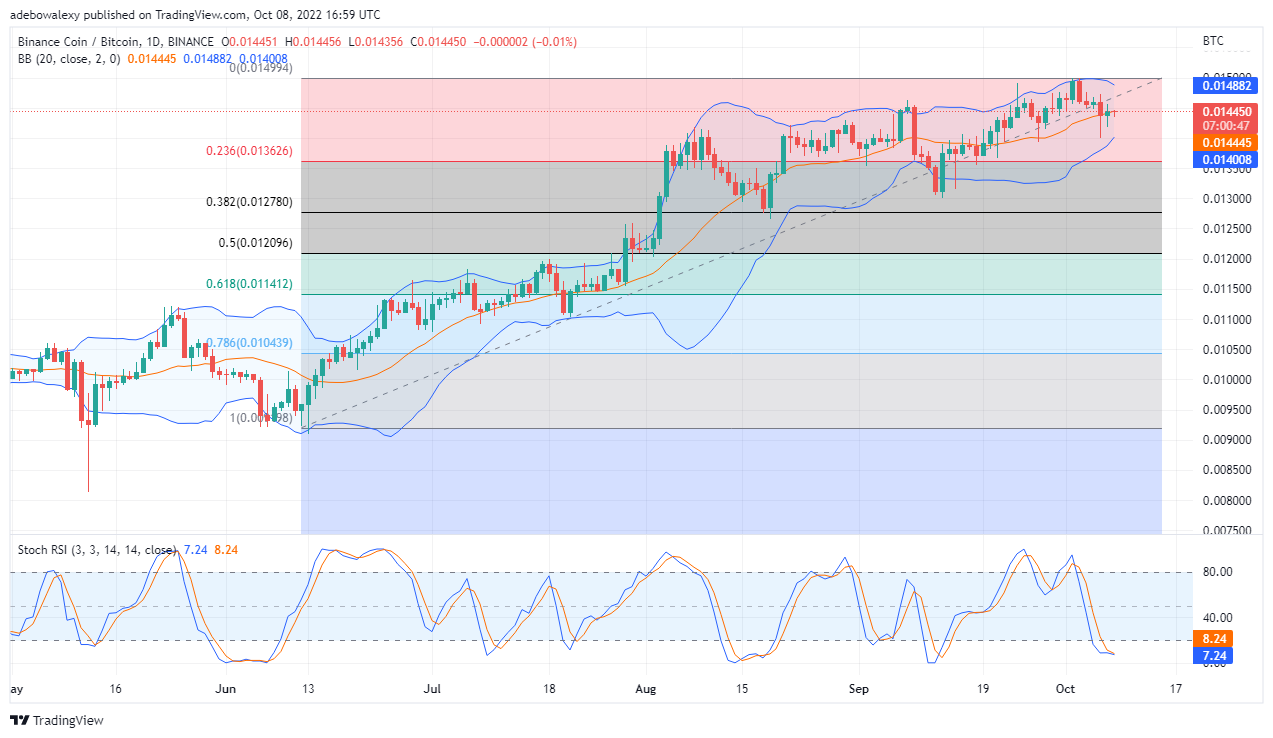
On the BNB/BTC 24-hour chart, technical indicators are showing indications that price may proceed in its upside path. The last price candle on this chart forms in favor of the seller, however only manages to bring the price to align with the MA of the Bollinger indicator.
Your capital is at risk.
Furthermore, the lines of the RSI have now converged at the highly sold region at 8% and 7%. If buyers eventually emerge as the winner in this ongoing trading session an upside crossover will occur from here. Consequently, this will see price action bouncing upwards from the MA of the Bollinger indicator towards 0.01500. Therefore, traders seeking entry can place a pending buy at 0.01458.
Tamadoge – Play to Earn Meme Coin
- Earn TAMA in Battles With Doge Pets
- Maximum Supply of 2 Bn, Token Burn
- Now Listed on OKX, Bitmart, Uniswap
- Upcoming Listings on LBank, MEXC


