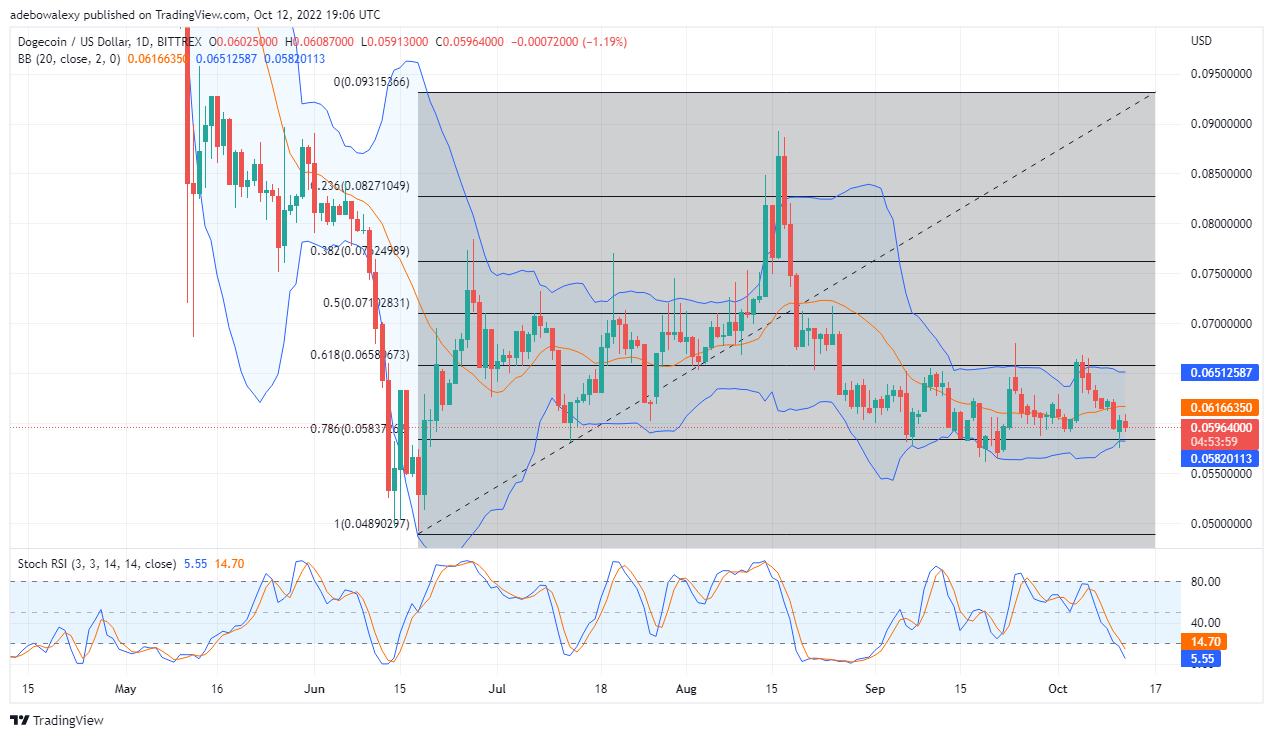
DOGE/USD price movements have been largely trading between two price levels, with a price level of $0.06581 as the resistance and $0.05837 as the support. Price action started this move around the 27th of August and has continued till now, with little fake-outs previously mentioned levels.
DOGE Analysis Statistics Data:
Dogecoin’s value now: $0.05964
DOGE’s market cap: $7.96 billion
DOGE’s moving supply: 132.67 billion
Total supply of Dogecoin: 132.67 billion
Dogecoin’s Coinmarketcap ranking: #10
As of now price action in the Dogecoin’s market is Retracing to the aforementioned support. Also, it appears as if the support of $0.05837 may hold. Therefore, we shall further examine this market as well as the DOGE/BTC market.
Important Value Levels:
Top Levels: $0.0.06000, $0.06300, $0.06500
Bottom Levels: $0.05964, $0.05910, $0.5850

Dogecoin Price Prediction Today October 13, 2022: DOGE/USD Is Falling to Lower Support
Looking at price action on the DOGE/USD daily market chart, it could be observed that price action is falling towards lower levels after hitting a strong resistance. Dogecoin price arrived at its current price via a long bearish candle which broke the MA of the Bollinger to the downside. Subsequently, a bullish candle soon formed but the bears are too strong to be bullied, as a bearish candle formed immediately after this. The Stochastic RSI proceeds into the oversold area with no signs of a bullish crossover. From all the signs gathered from trading indicators, traders can expect that price action will at least test the Fibonacci level of 78.60 of price $0.05837. Consequently, this level can be used as an entry point, and price may rebound upwards from there.

Dogecoin Price Prediction Today October 13, 2022: DOGE/BTC Corrects to the Downside
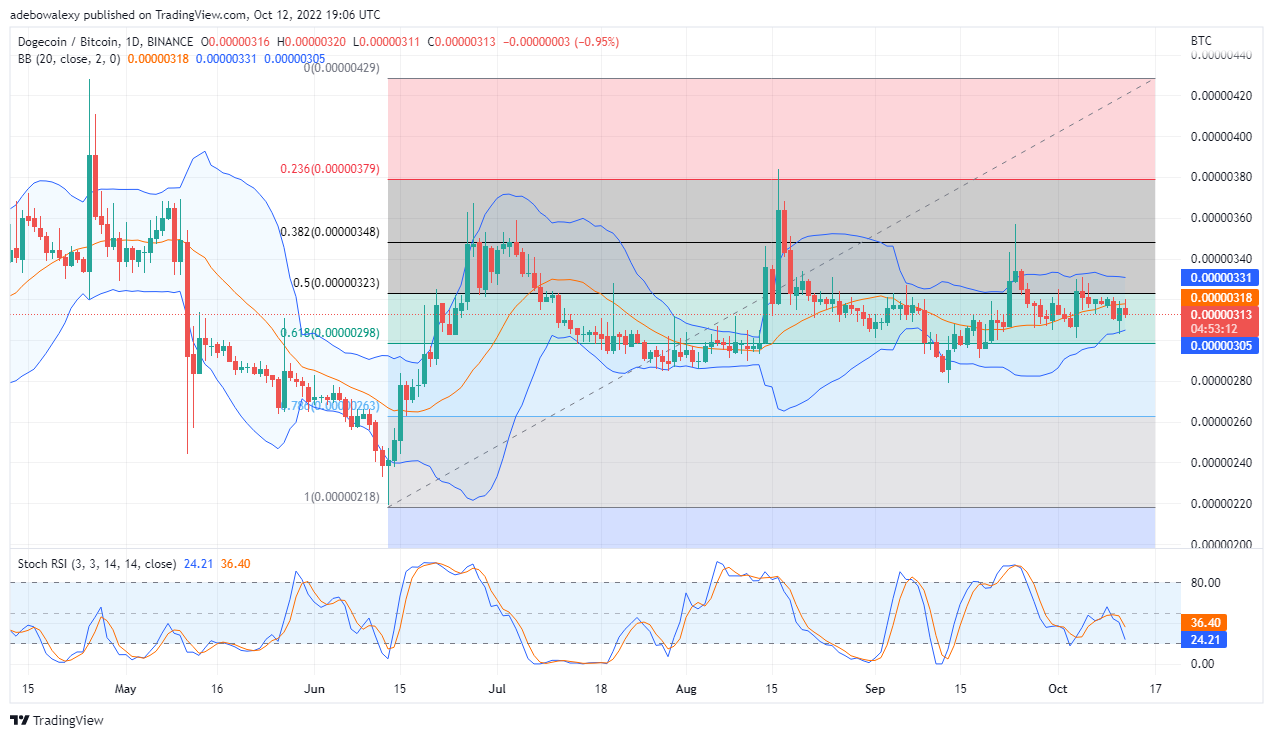
DOGE/BTC price action is pulling back after faking out of the resistance level formed by the 50 Fibonacci levels. Furthermore, price action has fallen below the MA of the Bollinger band, and now heading toward the floor of the Bollinger indicator.
Your capital is at risk.
From the look of the Bollinger indicator curves, the current price downwards correction may break the support of 0.00000298, at least in a fake-outs. This is because the curves are still at the 36% and 24% levels with no signs of performing a bullish crossover yet, as it progresses to the downside. Therefore, traders can anticipate the price level of 0.00000298 as a price rebound point, using it as a potential entry point into this market.
Tamadoge – Play to Earn Meme Coin
- Earn TAMA in Battles With Doge Pets
- Maximum Supply of 2 Bn, Token Burn
- Now Listed on OKX, Bitmart, LBank, MEXC, Uniswap
- Ultra Rare NFTs on OpenSea


