Polkadot price has retraced on its chart over the last 24 hours. The coin has started to register sideways movement on its one-day chart. During this period, the coin lost close to 2% of its market value.
In the last week, DOT registered more than 6% appreciation, which caused the bulls to gain stamina and break past the consolidation phase.
The technical outlook for the coin remained positive; however, the indicators indicated that the bullish momentum was fading off the charts.
Bitcoin also retraced slightly on its chart. Many altcoins have also started to trade sideways following BTC’s price action.
Bulls for Polkadot price can make a comeback if the coin manages to push above the $6.70 price mark. Consistent lateral trading can cause the altcoin to dip further on its chart.
It is important that Polkadot price remains above its local support level of $6.30. If the coin loses that support line, then there could be a further downfall.
The broader market continues to show mixed trading signals, with some coins losing strength while the likes of Dogecoin and Shiba Inu gain further bullish momentum.
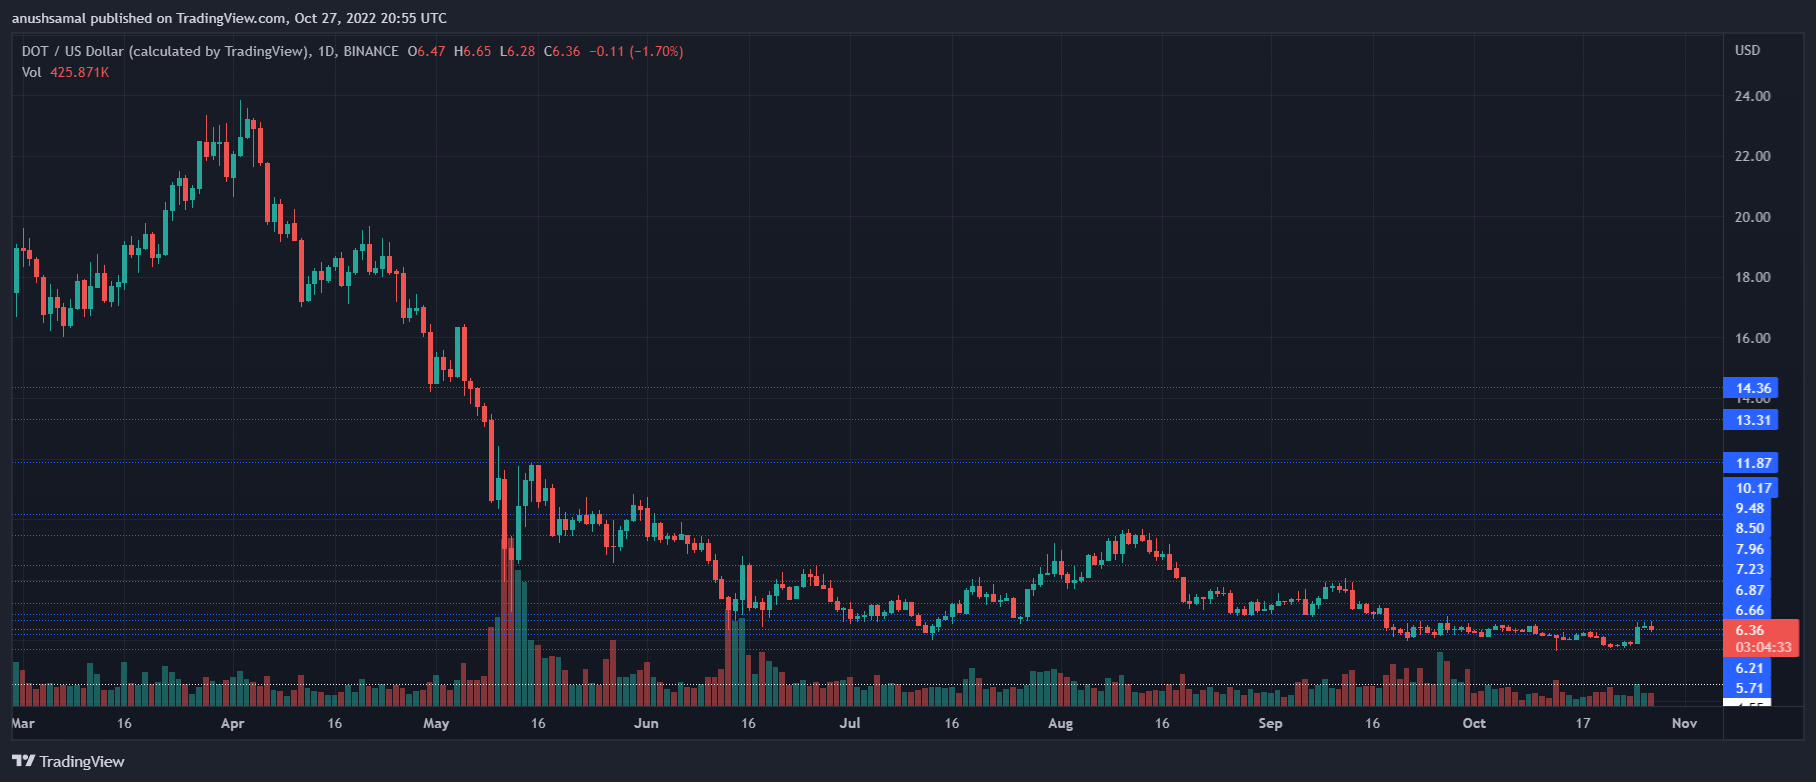
Polkadot Price Analysis: One-Day Chart

DOT was trading at $6.36 at the time of writing.
The altcoin had witnessed weeks of price consolidation until Bitcoin finally registered bullish price action.
Even though Polkadot’s bulls pushed hard to break past the $6 price mark, the coin has seemed to lose its bullish strength.
Immediate resistance for Polkadot stands at $6.70. Moving above that level can help DOT to trade closer to the $7 price mark.
That level can help the coin claim the bulls back again.
The closest support line that Polkadot has to defend is at $6.30. Losing this line will drag the price of the altcoin to $5.80. The amount of Polkadot traded in the last session fell slightly, indicating that selling pressure increased.
Technical Analysis

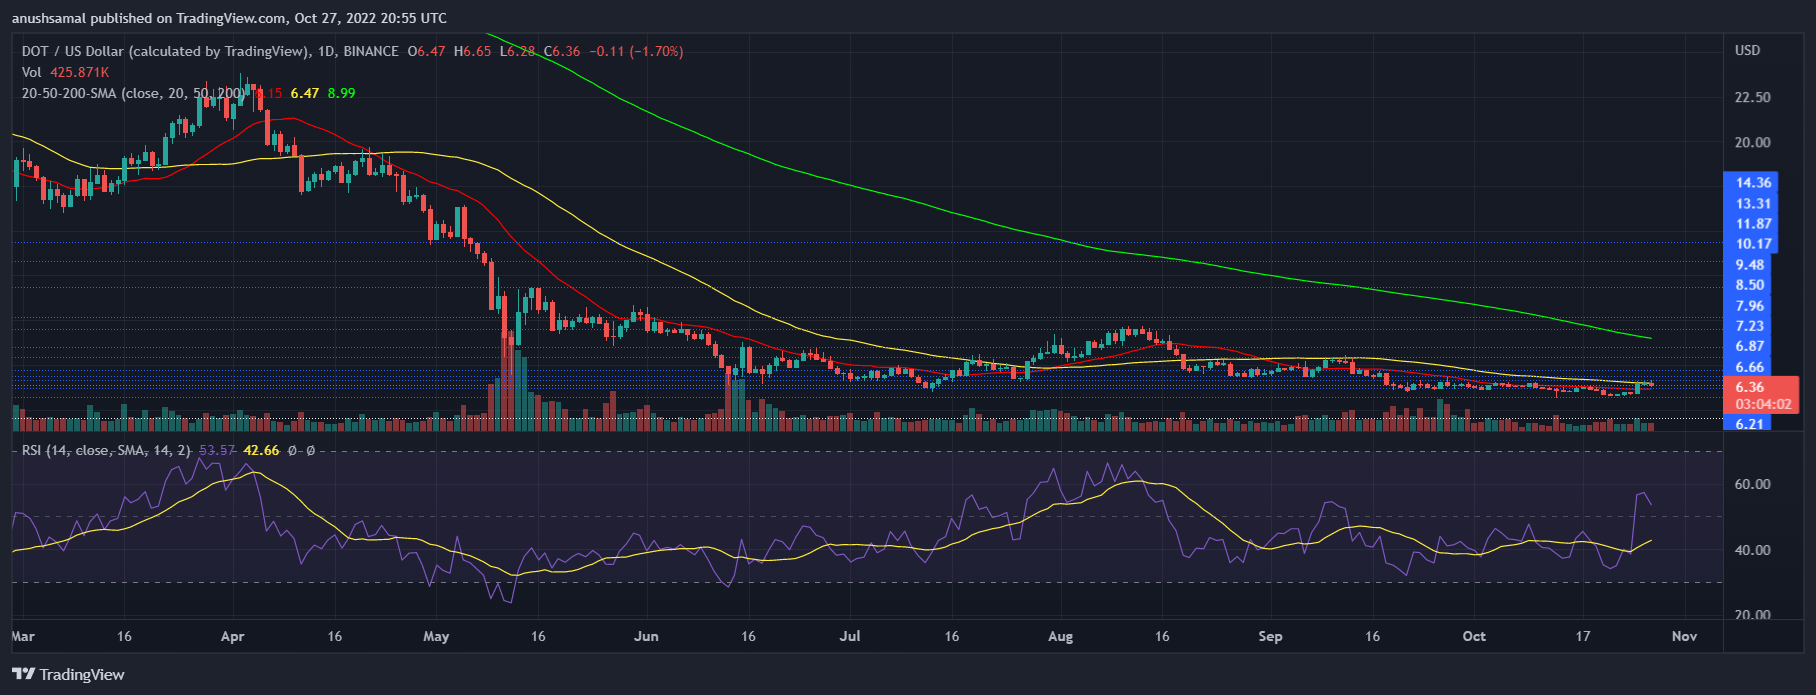
The altcoin swiftly moved into the positive buying zone as soon as it gained its value. However, at press time, it registered a downtick in buying pressure.
The Relative Strength Index was above the half-line but it displayed a downward movement, indicating a fall in buyers and demand for the altcoin.
Polkadot price was also moving below the 20-SMA line, indicating that demand was declining and that sellers were driving price momentum.

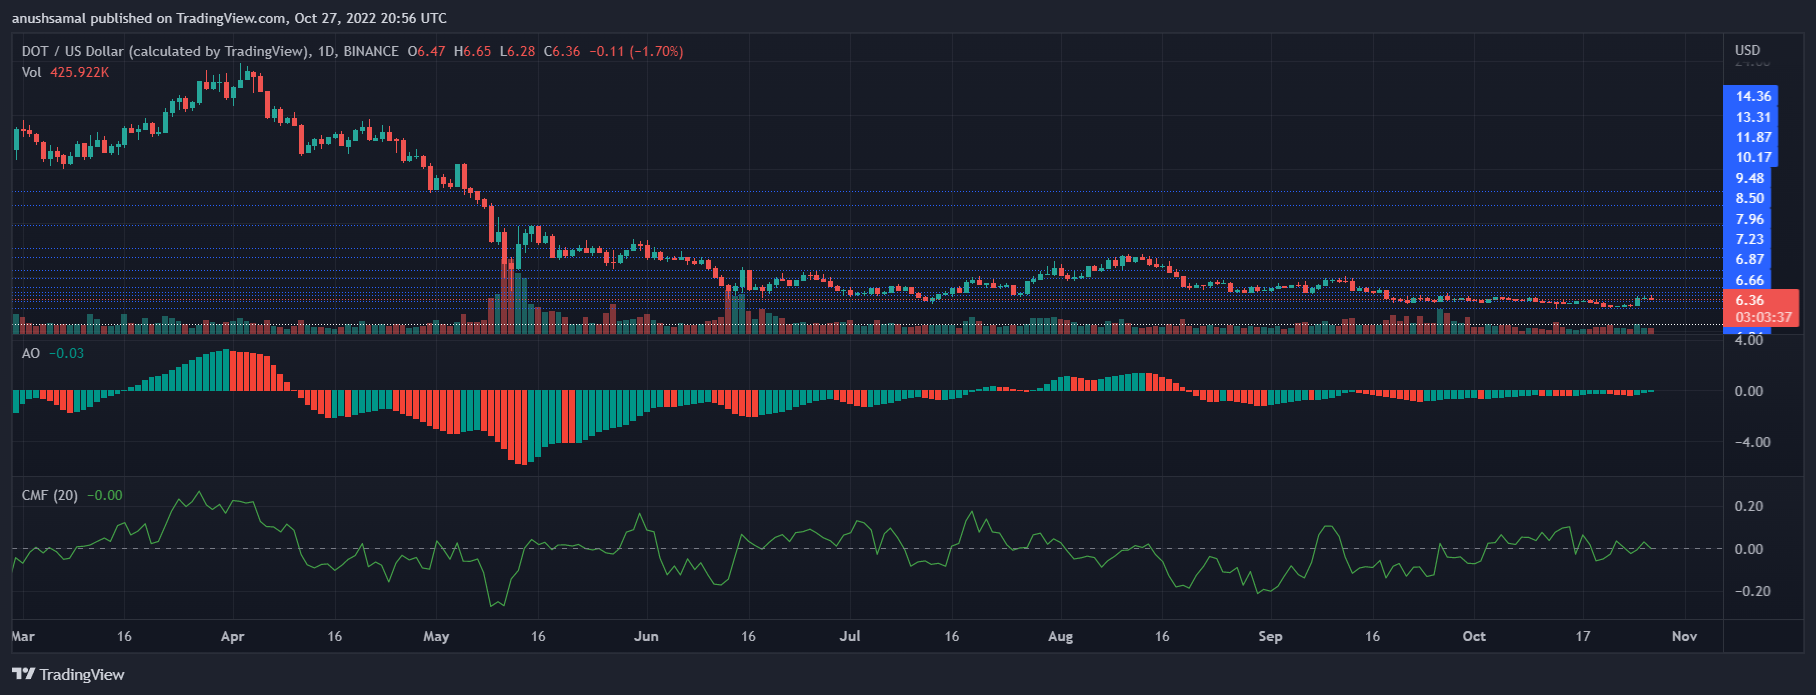
Other technical indicators also indicated that the bulls were slowly fading out of the market. The Awesome Oscillator depicts the price momentum, it formed green histograms under the half-line.
This formation meant that the coin was about to witness a further fall in price.
The Chaikin Money Flow accounts for the capital inflows and outflows of the asset.
The indicator was on the half-line with a downtick, signifying that capital inflows declined over the last 24 hours.
Featured image from FinanceFeeds, chart from TradingView.com


