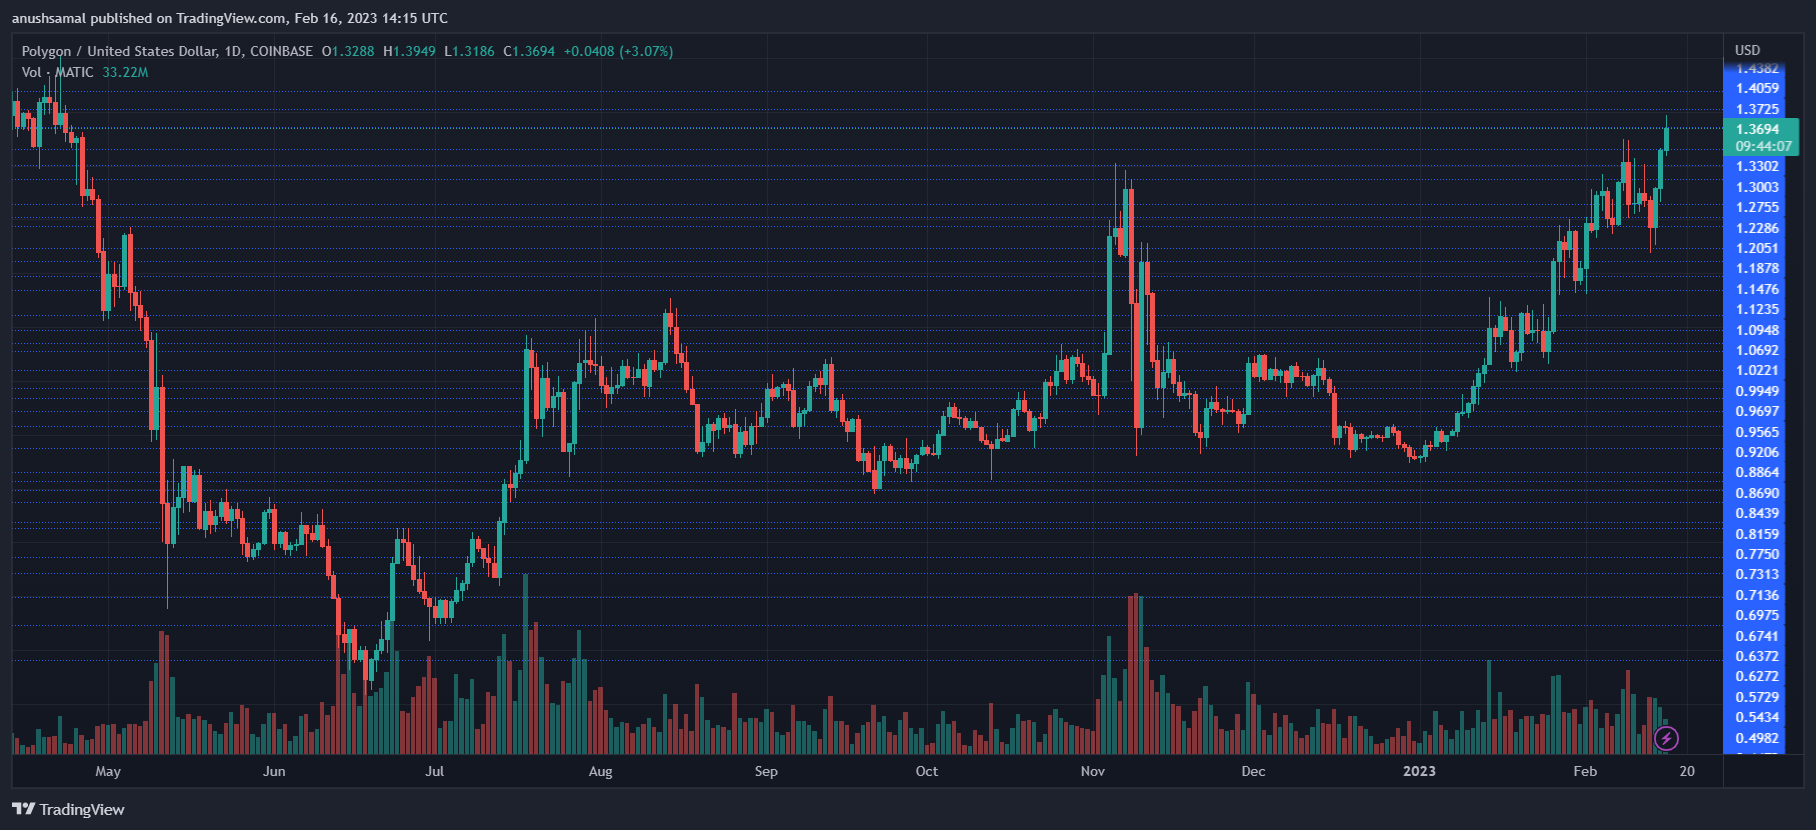
The MATIC price has been depicting bullish sentiments over the past few days, pushing the altcoin to break past its rigid price resistance mark. Over the last 24 hours, the altcoin soared close to 8%, and MATIC appreciated by 4.7% in the previous week.
Bitcoin has begun to rally, and major altcoins and market movers have risen on their respective charts. The technical outlook has started towards bullish strength mounting on the chart. The buying strength noted an increase, which automatically meant that demand and accumulation also shot up on the chart.
This indicated that buyers are slowly gaining confidence in the asset’s price movement. The first point of resistance for MATIC was at $1.26, which the altcoin managed to breach after several attempts.
Once the altcoin cleared the price above the ceiling, MATIC retested the $1.30 price. MATIC has been stuck under it for several months. If buying pressure and demand remain consistent, MATIC can touch the next price ceiling; however, the possibility of a price correction cannot be ruled out.
MATIC Price Analysis: One-Day Chart

The altcoin was trading at $1.37 at the time of writing. The movement of MATIC has been steady ever since it broke past the $1.30 resistance mark. Immediate resistance for the coin stood at $1.40. Moving above that level will take the altcoin to $1.43 before the coin retraces.
In the event of a price correction over the subsequent trading sessions, local support for the altcoin was at $1.33 and then at $1.30.
A fall below the $1.30 level can drag the altcoin to $1.22. The amount of MATIC traded in the last session was green, which meant that buying pressure continued to increase in the market.
Technical Analysis

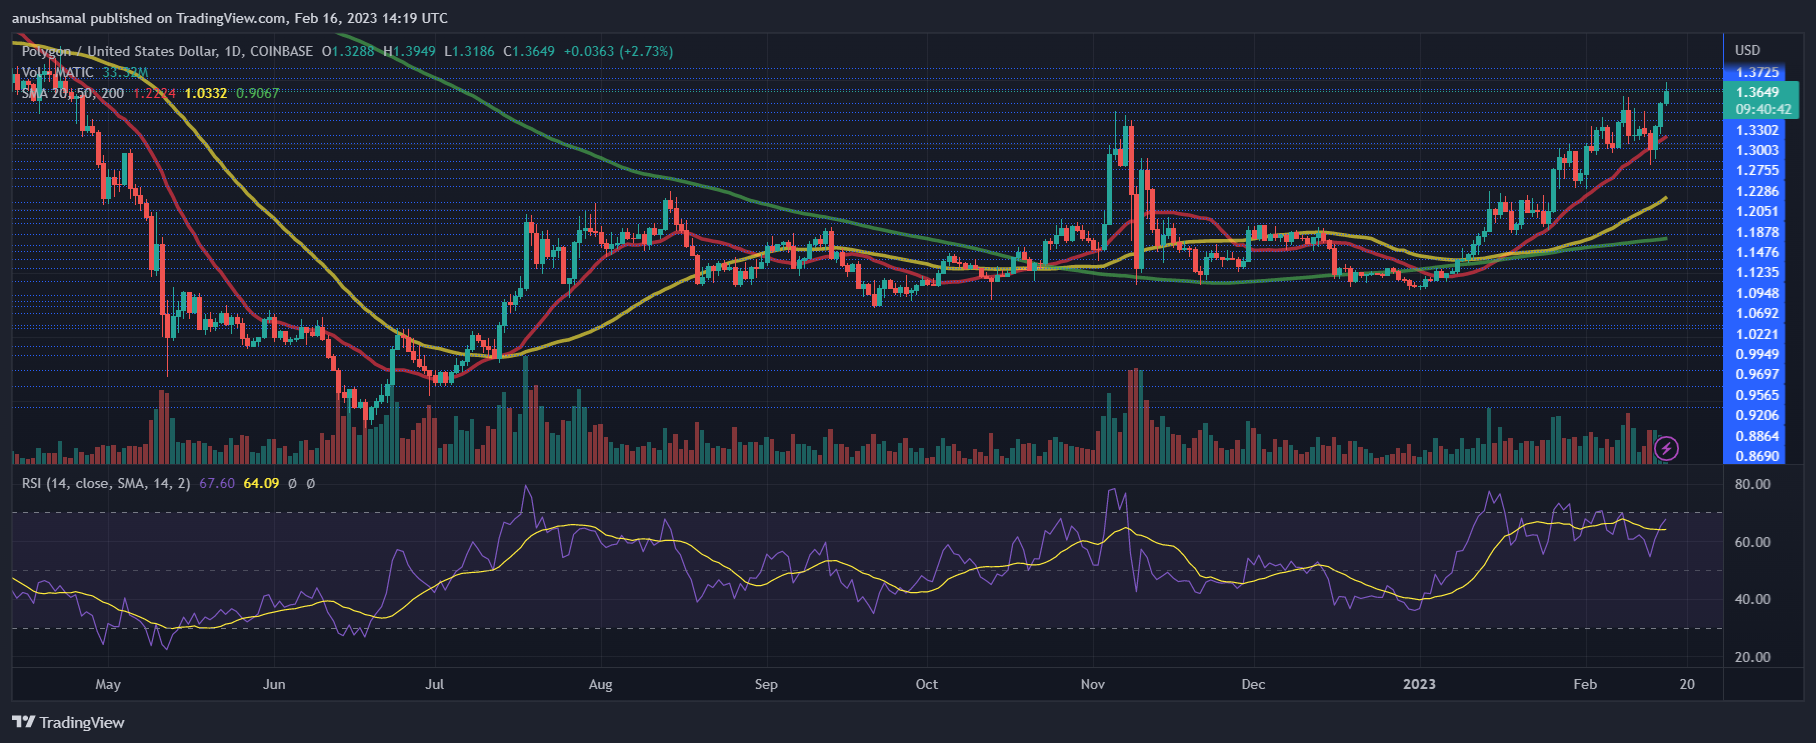
As the coin broke above the $1.30 price mark, the coin swept past the overbuying zone, slightly retraced from that zone too. In press time, however, as demand shot up, the coin registered an uptick in buying strength.
The Relative Strength Index stood above the 60-mark and was moving close to overvalued territory. This was a sign of bullishness. Similarly, the MATIC price moved above the 20-Simple Moving Average line as buyers were driving the price momentum in the market.

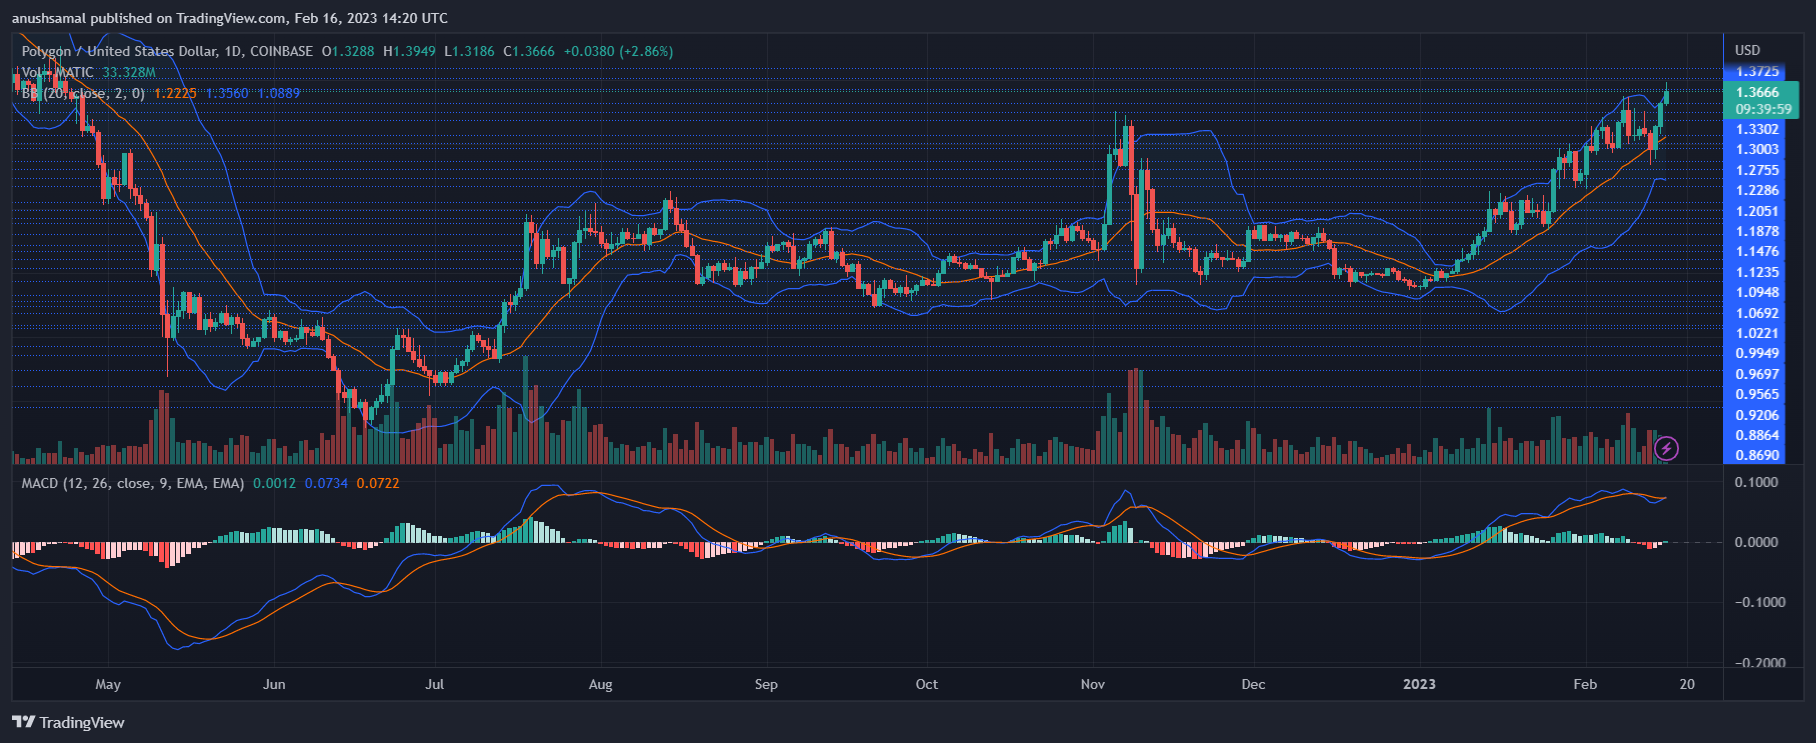
Per the increase in buying strength, other indicators have also pointed toward bullish intent for the altcoin. The Moving Average Convergence Divergence indicator depicts price momentum and change.
The indicator briefly formed green signal bars, tied to buy signals and a possible rise in price. Although the price might rise over the subsequent trading sessions, it is uncertain if MATIC will break past the $0.40 mark over the immediate trading sessions. Bollinger Bands indicate price volatility and fluctuation; the bands were wide but parallel.
This suggested that the coin could remain in a range before breaking to the upside or moving south, depending on how consistent demand for the altcoin is.


