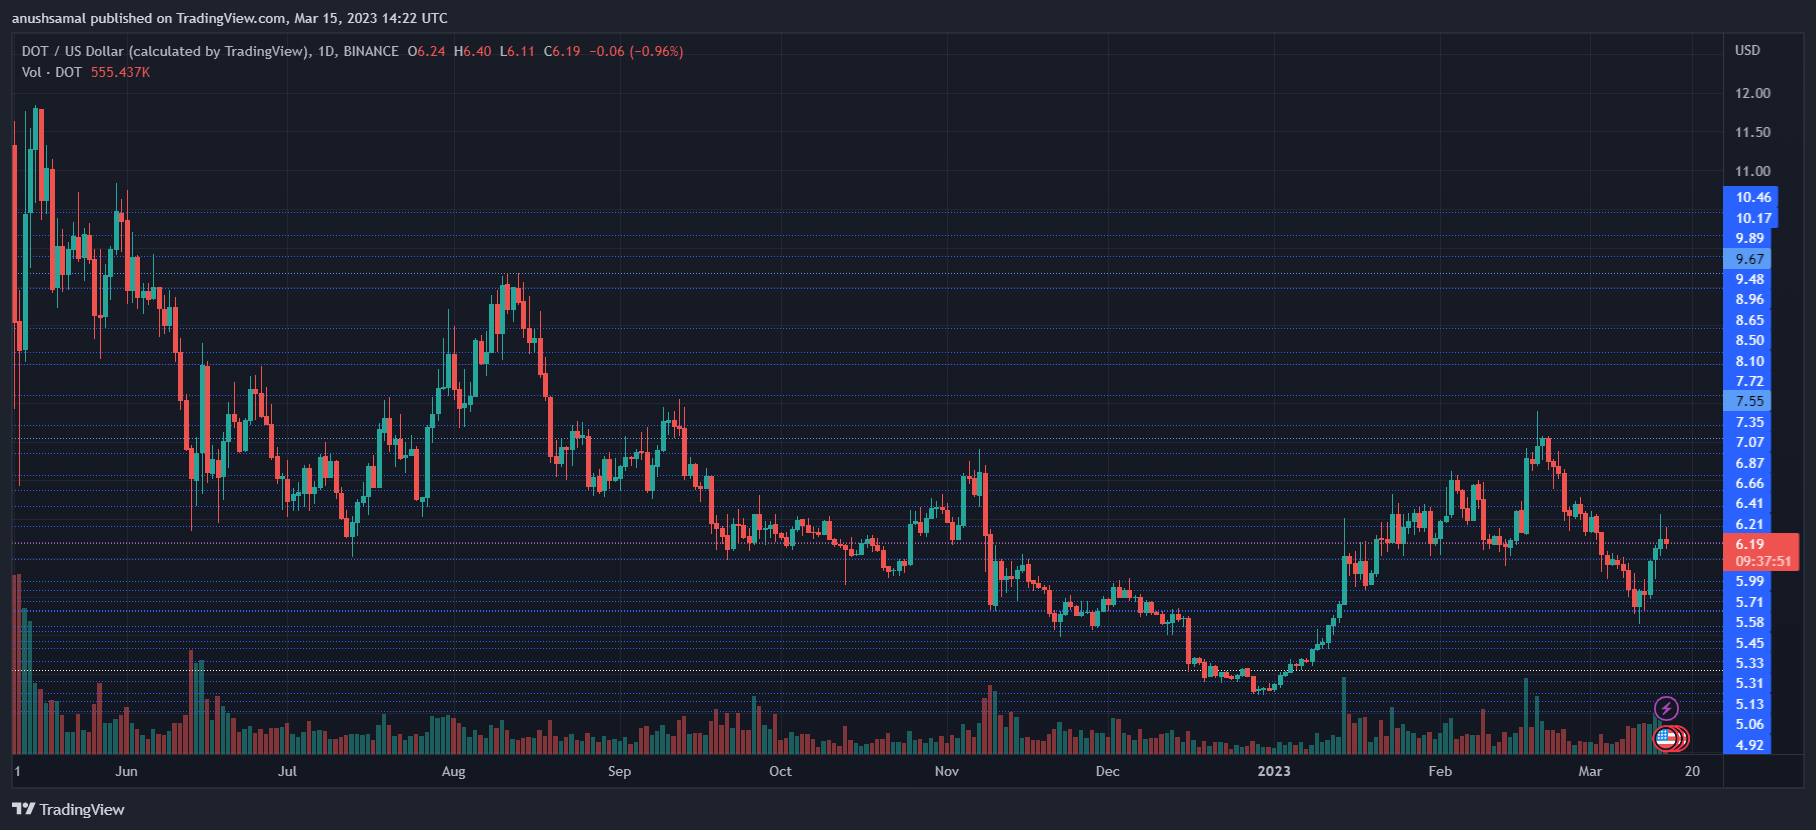
Polkadot price noted a fresh decline on its one-day chart. The price of the altcoin has moved closer to its crucial support line in the same time frame. Over the last 24 hours, DOT has lost around 4% of its market value, and in the last week, DOT secured a 6% appreciation.
The technical outlook displayed that the bulls were attempting to secure the price action in the market. Although the indicators reflected positive movement, the bulls were not entirely back in the market. Despite the demand for the coin increasing, DOT remained in bearish territory.
Buyers were also struggling to take sellers over entirely. If buyers do not re-enter the market over the next trading session, the altcoin will lose its present support level. In the event that DOT falls below the immediate price floor, the bears could gain control of the market for a considerable number of trading sessions.
Polkadot Price Analysis: One-Day Chart

DOT was trading at $6.19 at the time of writing. Over the past week, the coin has recovered and pushed itself to revisit the $6 price zone. Overhead resistance for the altcoin stood at $6.41 and then at $6.80, respectively.
On the flip side, if DOT loses further value on its one-day chart, then the first stop would be at $6 and then at $5.70.
The inability to trade above $5.70 will bring Polkadot down to $5.33. The $5.33 level would also act as a propelling point for the Polkadot price. The amount of DOT traded in the last session was red, indicating that sellers were still in control of the altcoin.
Technical Analysis

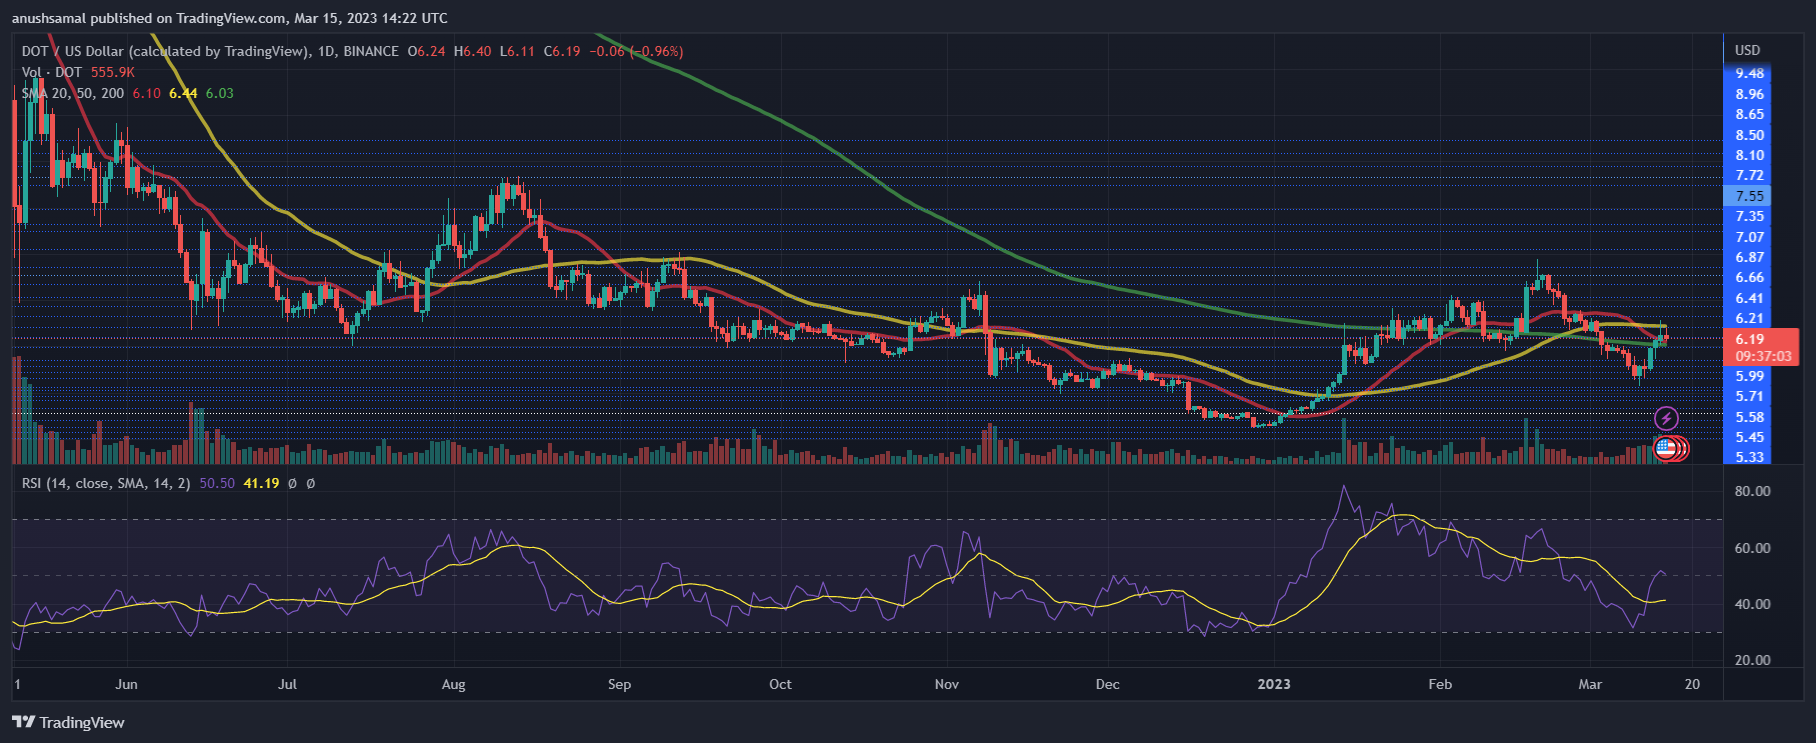
Despite recovery on the weekly chart, DOT declined at press time, as did its buying strength. The Relative Strength Index stood on the 50-line, with a decline at the time of writing. This meant that buyers started to exit the market.
This could be followed by a fall in price over the next trading session. Similarly, DOT trended below the 20-Simple Moving Average (red), which suggested that sellers were driving the price momentum in the market. Indicators point towards the possibility of a price drop in future trading sessions.

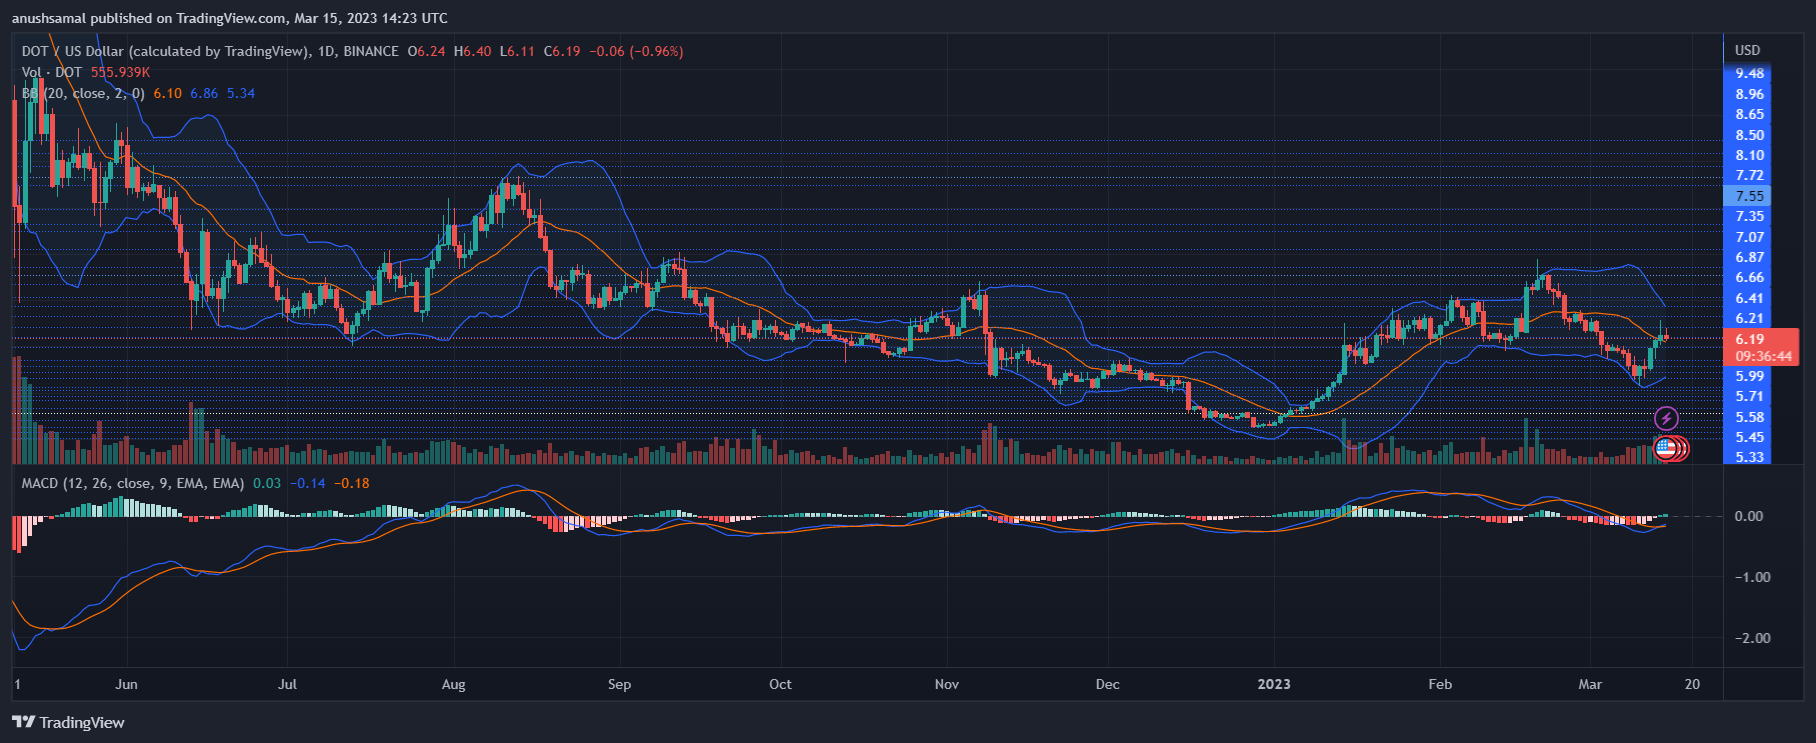
Other indicators have displayed mixed trading signals on the one-day chart. The Moving Average Convergence Divergence which indicates the price momentum and reversal formed green signals bars. These signal bars were tied to buy signals for the altcoin.
This sign could mean that the price would fall in the upcoming trading session but would also recover after the fall. Bollinger Bands reveals price volatility and fluctuation. The bands grew closer to each other indicating that price volatility may decline in future trading sessions.


