Chainlink (LINK) has seen significant gains in the last few days, with a 4% increase in the past 24 hours. This rise has helped LINK recover from its weekly losses. Currently, the altcoin is sitting on a crucial support level below a significant price barrier.
A breakthrough above this barrier would indicate a shift in price direction. On the daily chart, the technical outlook for LINK is bullish, with buyers showing confidence and demand increasing. Accumulation has also turned positive.
However, like many altcoins, LINK has been unable to break through its immediate resistance marks due to Bitcoin’s indecisive price action.
If Bitcoin manages to reach the $29,000 price zone again, LINK may be able to surpass its overhead ceiling. Until then, LINK needs to be cautious of the $7.30 support line. If it falls below that level, the bullish sentiment may disappear from the charts.
Chainlink Price Analysis: One-Day Chart

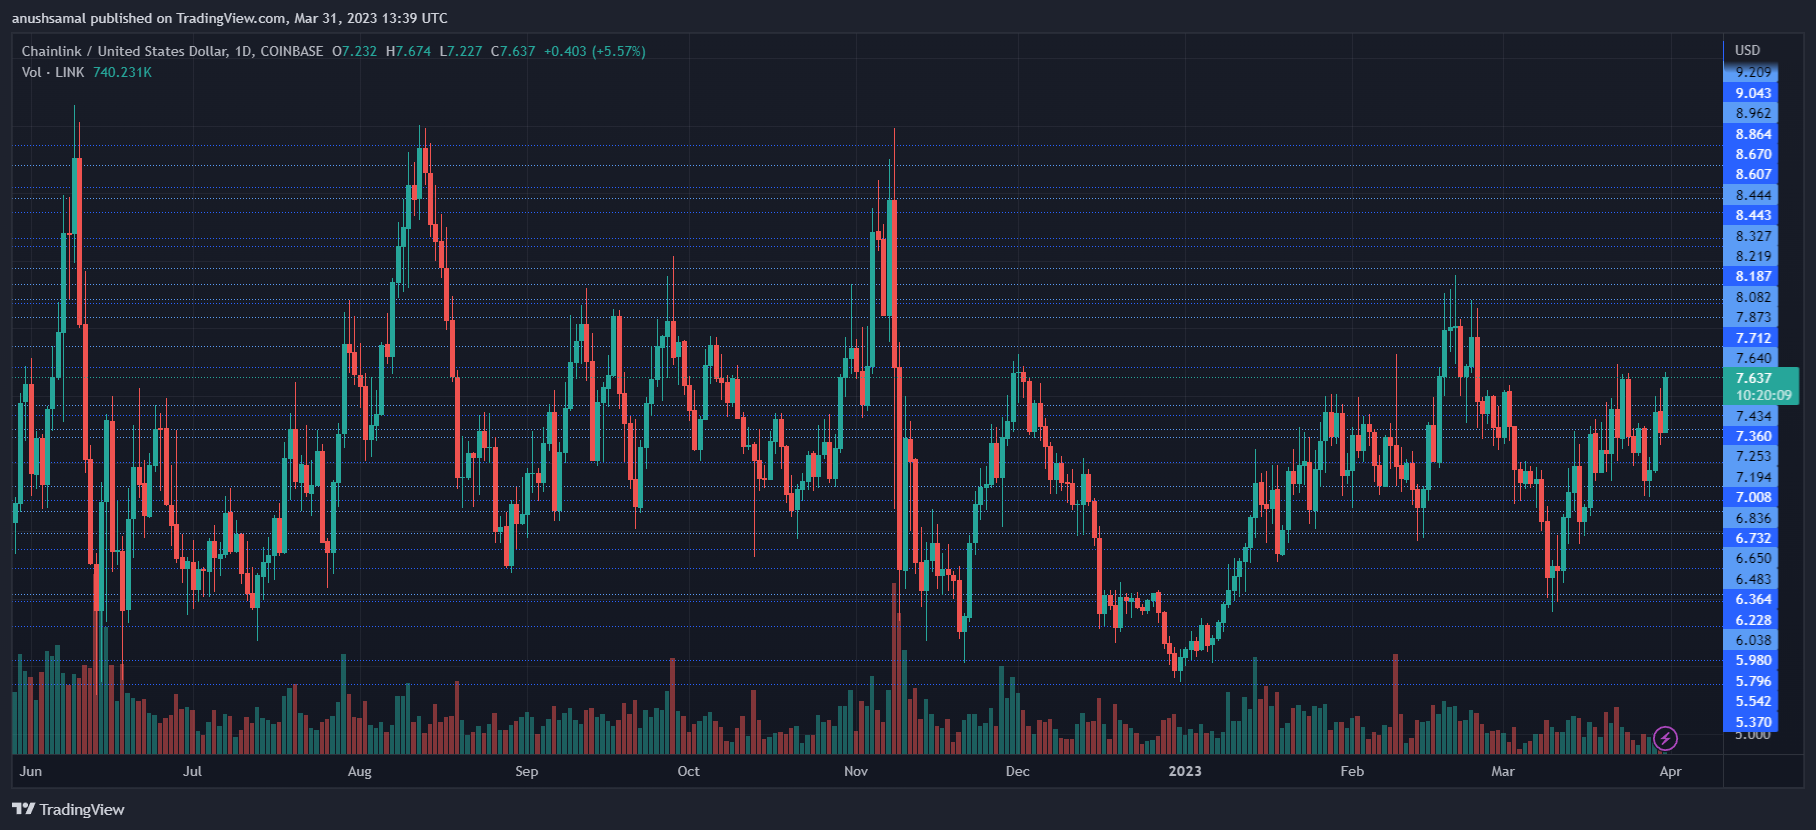
As of writing, LINK is trading at $7.63 with an immediate resistance level of $7.80. If the coin manages to surpass this level, it could potentially reach $8 and secure bullish momentum.
However, LINK needs to breach the crucial resistance at $7.70. This could be achieved through an increase in demand for the coin.
The critical support level for LINK is currently at $7.30. A fall below this level could cause the price to drop to $6.80, which would signal a bearish trend. The amount of LINK traded in the last session was in the green, indicating an increase in buying strength.
Technical Analysis

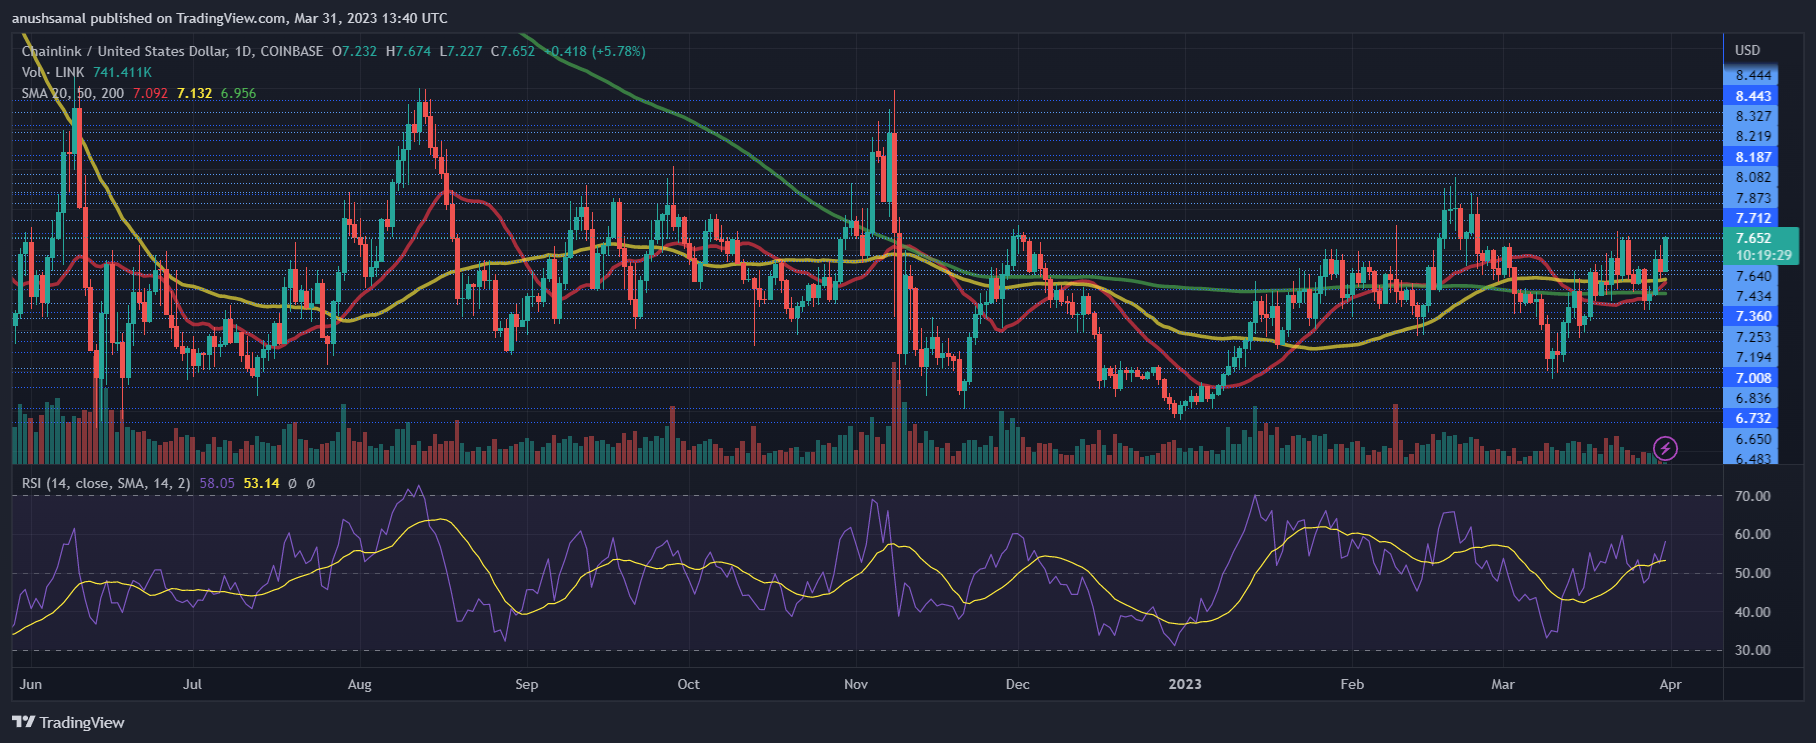
As the price of LINK continued to climb on the chart, there was a noticeable increase in buyer confidence. This was reflected in the Relative Strength Index (RSI), which surpassed the half-line and indicated that buying strength had overtaken selling strength in the market.
Additionally, LINK moved above the 20-simple Moving Average (MA), as a further indication of an increase in demand and that buyers were driving the price momentum in the market.

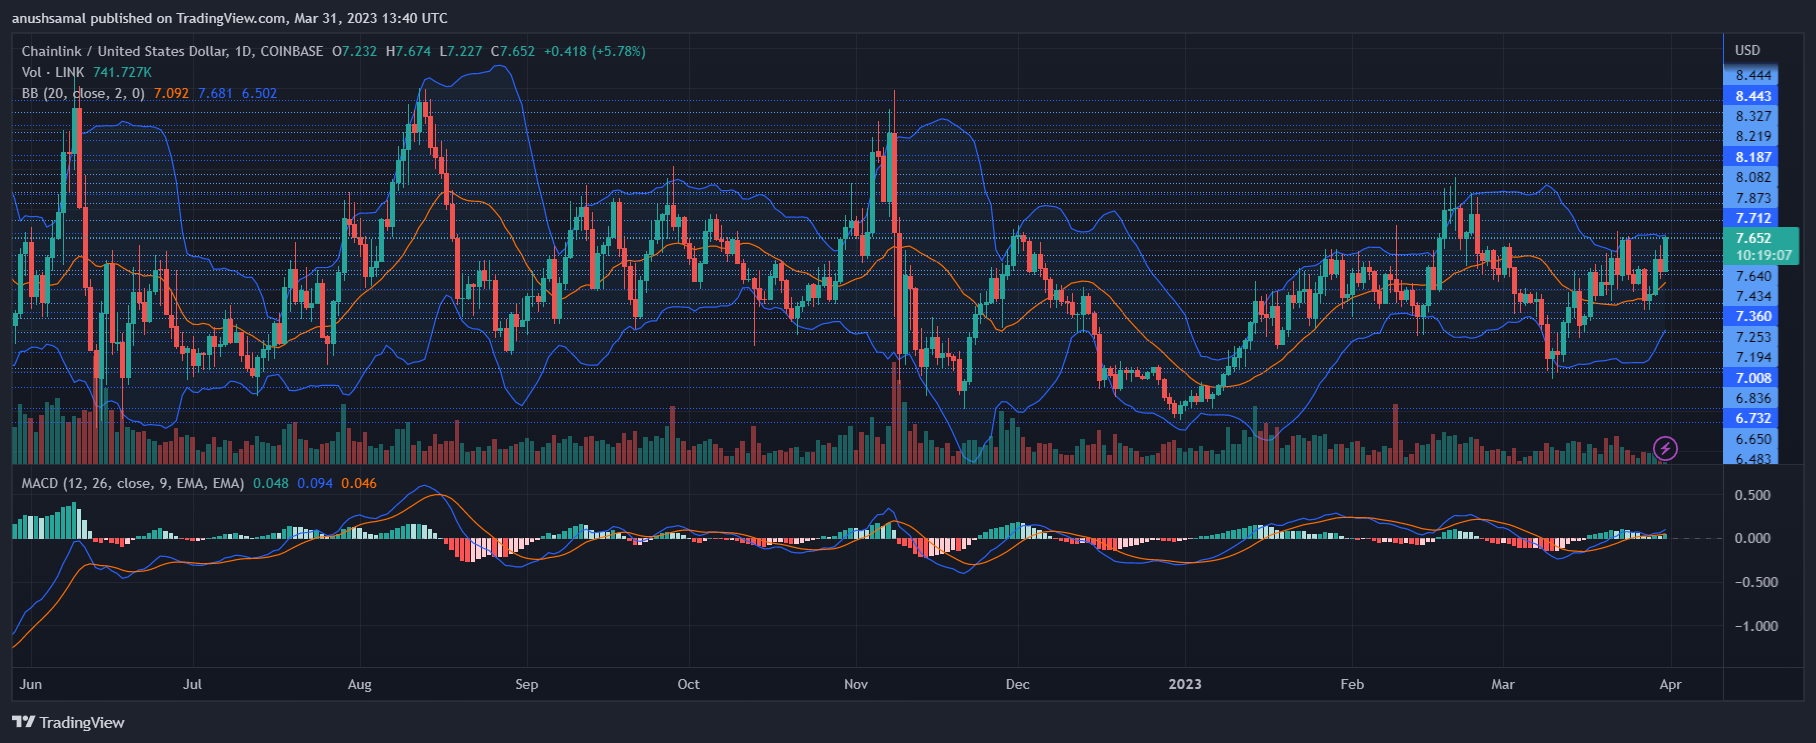
Other technical indicators have also displayed a positive price action for LINK. The Moving Average Convergence Divergence (MACD), which indicates both price momentum and changes has formed green signal bars tied to buy signals for the altcoin. This suggests an upward trend in buying strength.
The Bollinger Bands reads the price volatility and fluctuation. The bands have been wide, indicating that price action could witness significant fluctuation in the upcoming trading sessions.
Despite the positive outlook, broader crypto market strength remains crucial for the altcoin’s price action over the subsequent trading sessions.


