Analysts from both traditional financial markets and the Bitcoin space are currently looking at the yield curve with concern and are ringing the alarm bells. The 10-year and 3-month yield curve hit another historic low in the United States yesterday.
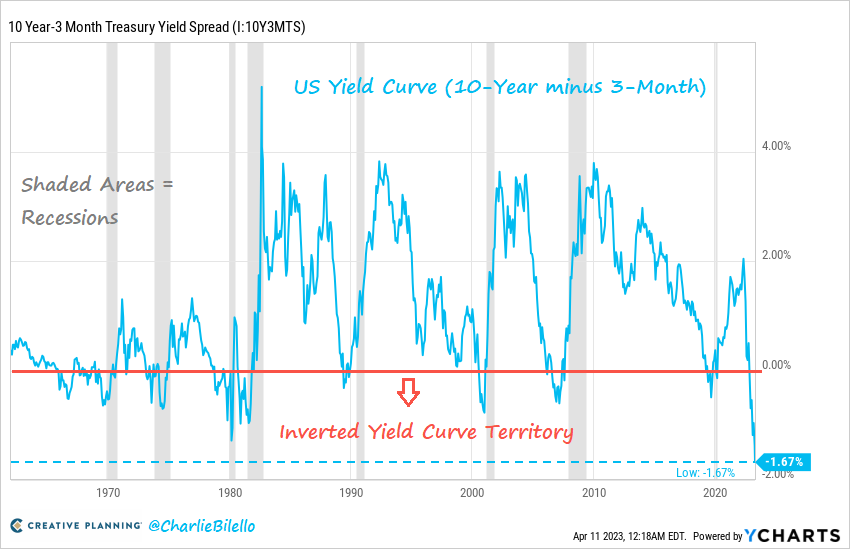
Charlie Bilello, chief market strategist at Creative Planning, drew attention to the historic data via Twitter and shared the chart below. He stated:
The 3-Month Treasury yield of 5.08% is now 1.67% higher than the 10-Year Treasury yield (3.41%). This is the most inverted yield curve in history.

What Does An Inverted Yield Curve Mean?
Every inversion of the yield curve in history so far has predicted a recession. But why is this the case? Simply put, when shorter-maturity bond yields are higher than longer-maturity bonds, it means the market is anticipating an economic slowdown or recession with lower interest rates.
The inversion of the US 10-year and 3-month treasury bill yield curve has occurred only four times in the last 100 years. The last three times occurred in 1980, 1973 and 1929. Each time there was a recession that brought the US economy to its knees and inflicted severe crashes on the stock market.
In recent weeks, the 10-year 2-year yield curve has already shown a historic negative divergence from the 10-year 3-month yield curve. However, as renowned analyst Lyn Alden, founder of Lyn Alden Investment Strategy, recently explained, the 10-3 curve actually has a slightly better track record to predict recessions and is the original academic study. In late March, Alden remarked:
In plain English, the 10-3 curve is saying ‘no recession in clear sight’ while the 10-2 curve is saying, ‘we’re probably getting close to a possible recession, but not confirmed, and probably many months away, but asset prices start to top around here.’
According to Alden, it was therefore not clear whether there would be an actual hard landing. But the data has now changed fundamentally in just two weeks. The 10-3 yield curve now also screams recession.
So when will a recession hit? In the past, the de-inversion of the curve signaled that an economic recession was a few months away. In recent weeks, the 10-year 2-year yield curve has already begun to show a rise, prompting some macro experts to warn of an imminent recession.
However, the curve is still well away from de-inversion. Predicting when is therefore still like looking into a crystal ball.

How hard will it hit the financial markets? In late March, Jurrien Timmer, director of global macro at Fidelity, wrote that traditional financial markets held up for a while in most cases before experiencing drawdowns of -11% to -51% in the months that followed. “Be careful what you wish for when it comes to Fed pivots,” Timmer warned.
What Does This Mean For Bitcoin?
Hence, despite Bitcoin’s current rising price, driven by hopes of an imminent pivot, a recession is lurking around the corner. For Bitcoin, this would be the first time it has found itself in a recessionary environment. How the BTC price will react is uncertain – will it decouple or follow the stock market?
Lyn Alden believes that the financial market is overfunded, so at the end of the day it comes down to whether or not assets produce cash flow at reasonable valuations, and when.
[I]f it’s a monetary commodity like gold or Bitcoin, it depends on how it structurally compares to its competitors like cash deposits and government bonds.
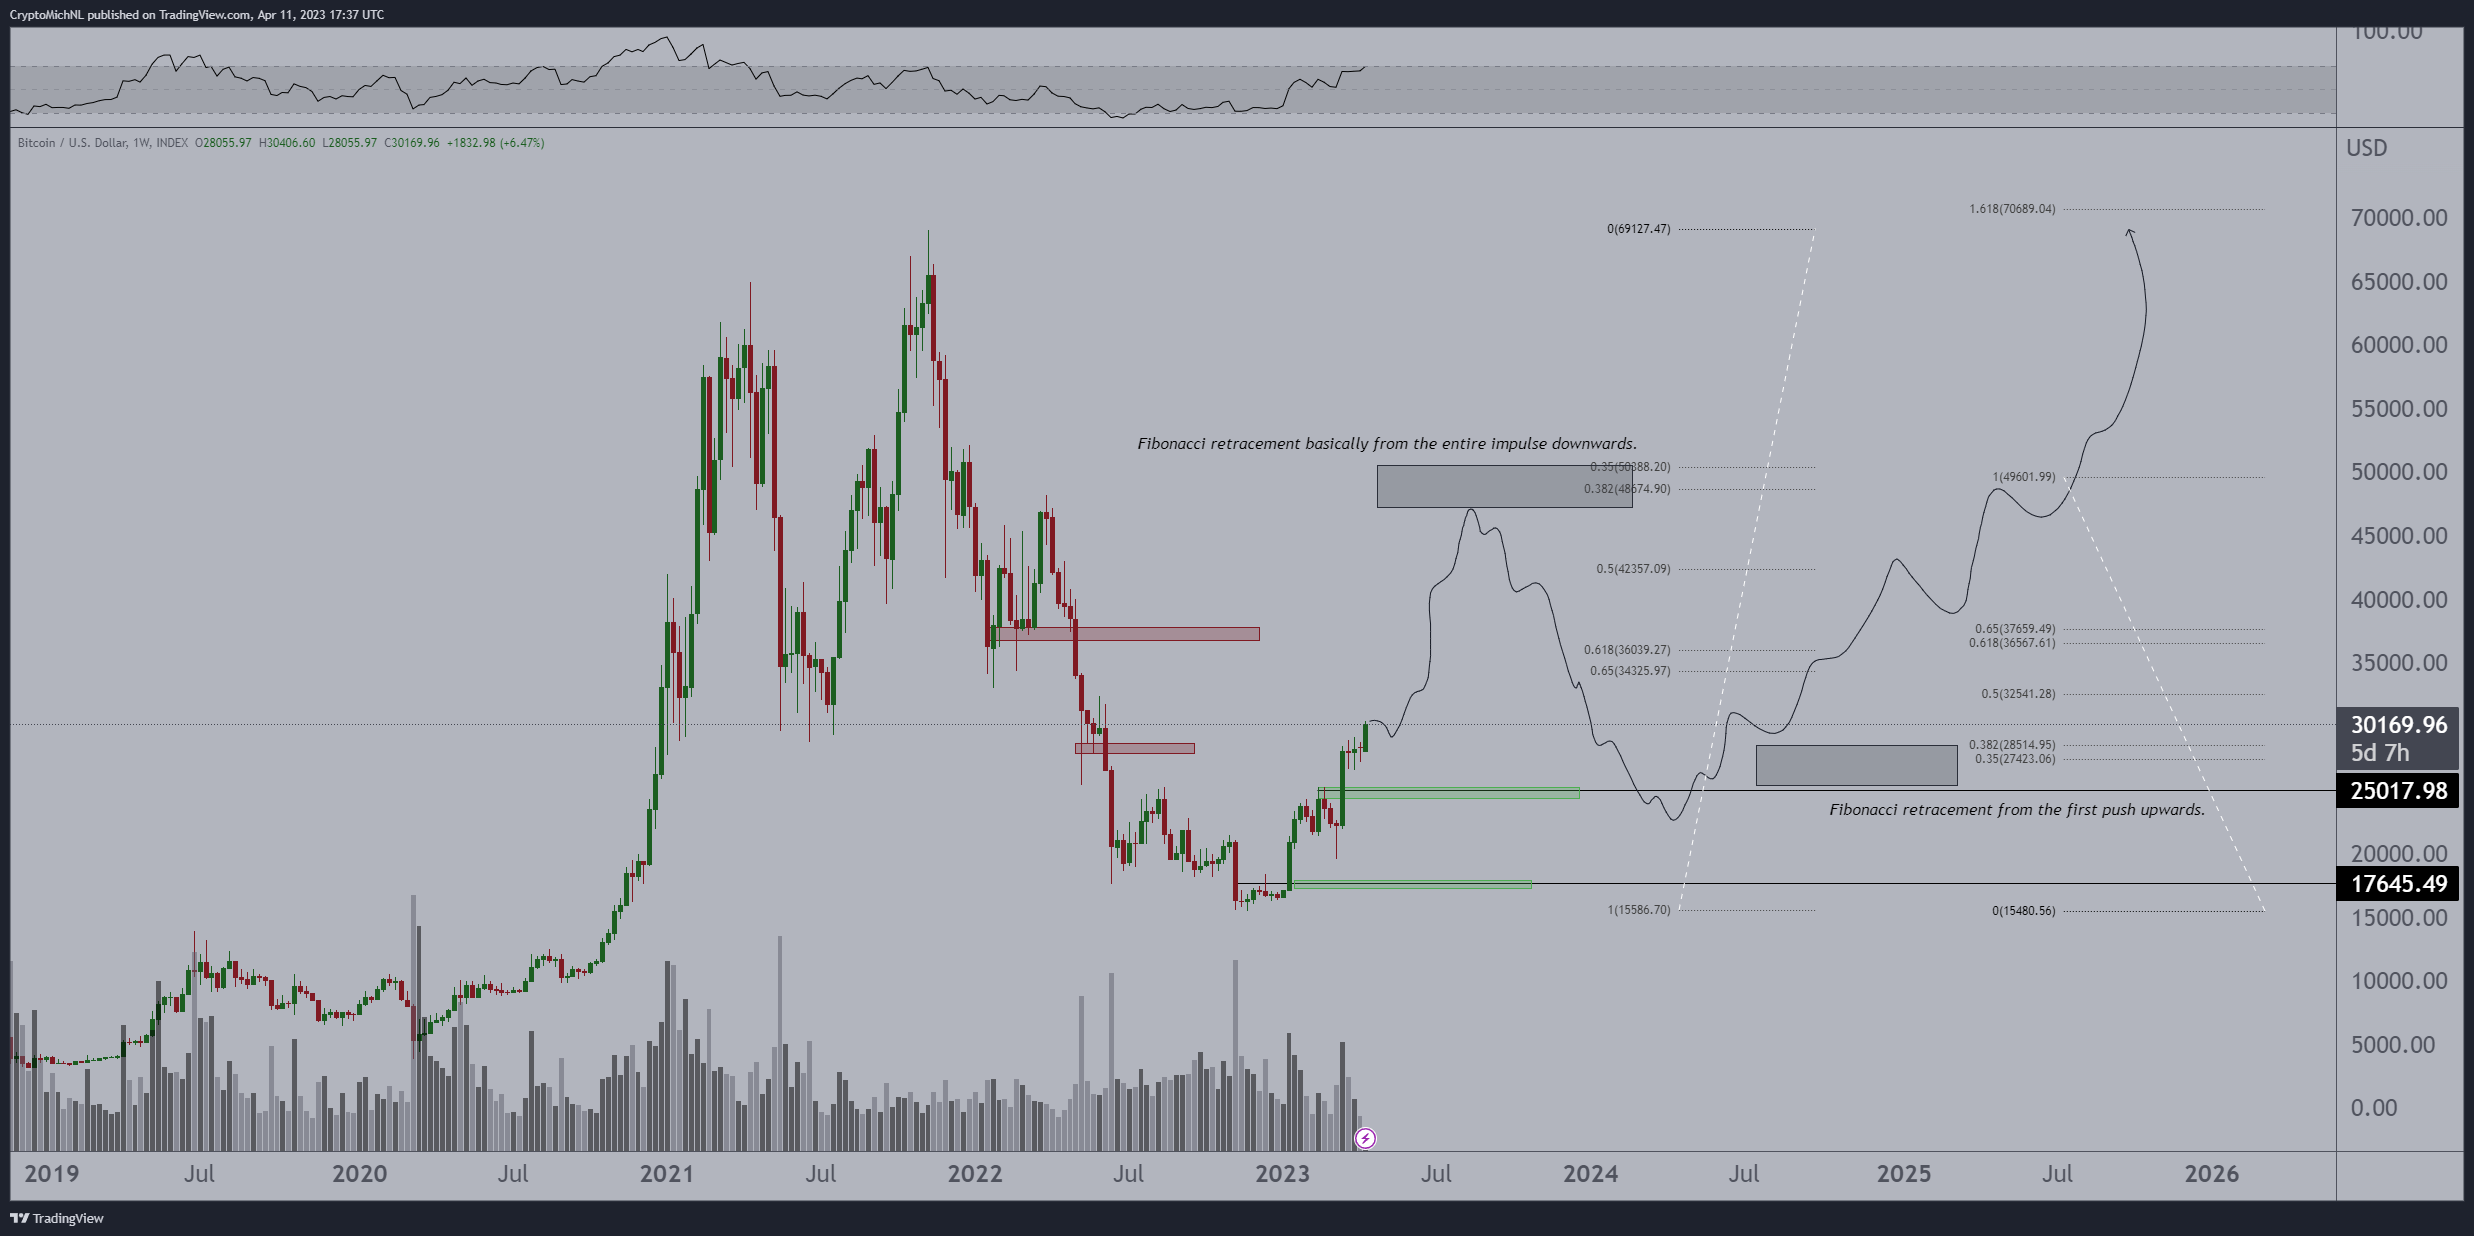
Michaël van de Poppe, founder of Eight Global, believes a recession could push Bitcoin into another sharp downturn. Before that, however, the technical analyst predicts a rally in the direction of $45,000 per Bitcoin:
Roughly speaking my thesis for Bitcoin. Still a vacuum in which we continue the upwards rally through Q2 as Powell comes to an end with the hikes.
Comparable to Q2 2019, which also rallied significantly. Correction to $25K in second half, as recession slams in.

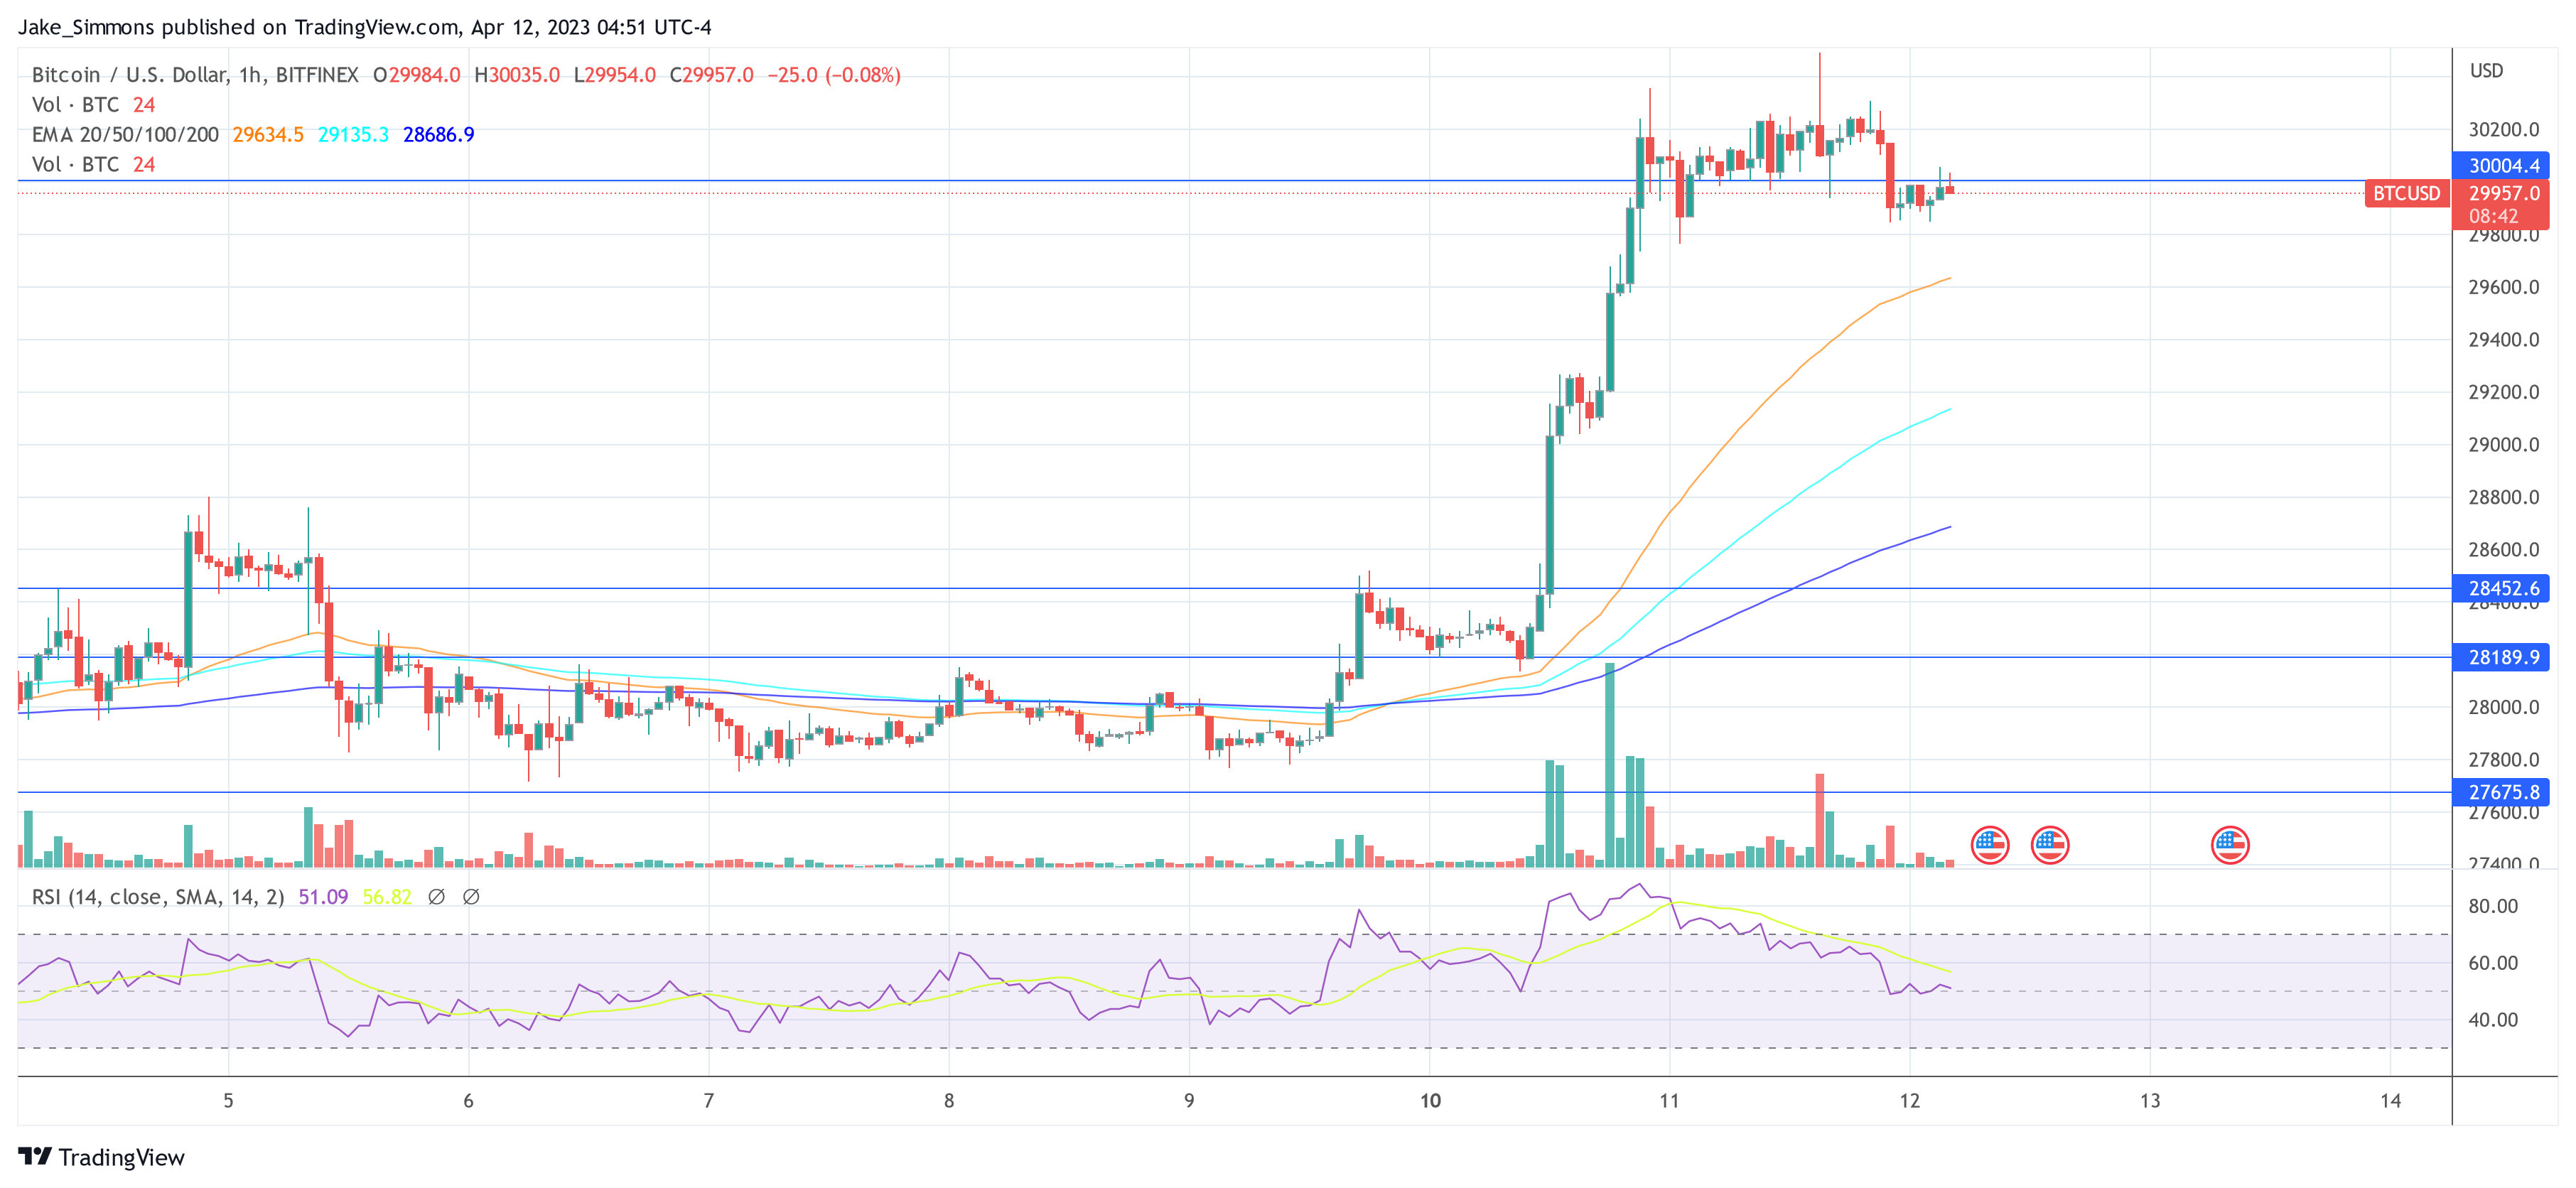
At press time, the Bitcoin price was hovering around $30,000. With today’s release of the CPI for March and the FOMC minutes, the market is in for a volatile Wednesday.


