On July 13, Ripple triumphed significantly in the United States District Court for the Southern District of New York on the XRP case. Judge Analisa Torres ruled in favor of Ripple in a case originally initiated by the Securities and Exchange Commission (SEC) in 2020.
In recently filed documents on July 13, Judge Torres issued a summary judgment, decisively supporting payment company Ripple and its claim over the SEC. The judgment affirms that XRP token sales made by the payment company, at the center of the case, are not classified as a security.
The decision immediately impacted the XRP price, which surged over 35% in the wake of the ruling. The ruling cleared a substantial part of Ripple’s operations from being targeted by the SEC’s crackdown.
The court’s decision acknowledged that the Programmatic Sales and sales made by Ripple executives Chris Larsen and Brad Garlinghouse do not qualify as investment contracts.
However, the ruling only partially resolves the legal dispute with the SEC. The court has invalidated the investment contract designation for Programmatic Sales and other forms of distributions, but other items remain disputed.
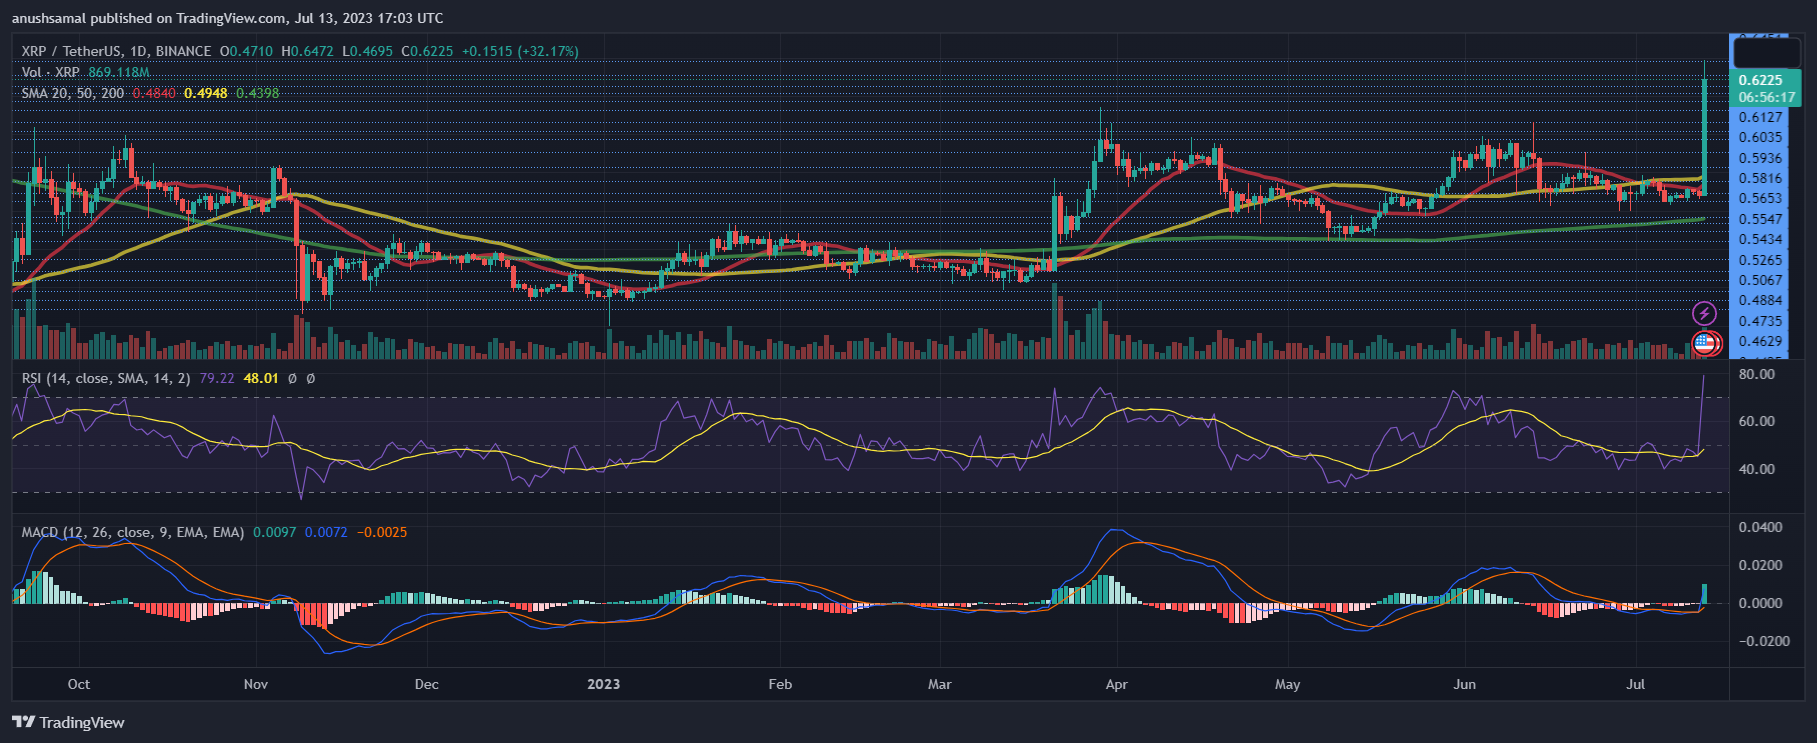
The value of XRP has surged from $0.45 to $0.62. This price surge has caused XRP to reach a yearly high. The coin attained this price level in early May of the preceding year.
XRP Price Analysis: One-Day Chart

On the daily chart, XRP has experienced an impressive 34% increase, trading at $0.62. Over the week, XRP has gained nearly 30%. However, as of the time of writing, the token was considered oversold. It suggests that a price retracement may be possible in the upcoming trading sessions.
In the past, when XRP reached $0.60, the price suffered a sharp drop shortly after that. The coin faces overhead resistance at $0.67.
Moving above this level could help XRP retain its gains for longer. If there is a price pullback, the first line of support is $0.57. A drop below this level would take XRP down to $0.50.
The technical outlook indicates excessive bullish strength, with demand and accumulation showing significant positivity.
The Relative Strength Index is above 80, which suggests that the token is overbought and overvalued, increasing the likelihood of a price retracement.
However, demand is expected to remain positive if the price stays above the 20-Simple Moving Average line (red), which coincides with the $0.58 price mark.
The Moving Average Convergence Divergence reflects price momentum and trend reversals and shows a tall green histogram, indicating a signal to buy. The next few trading sessions will be critical for XRP.


