Quick Take
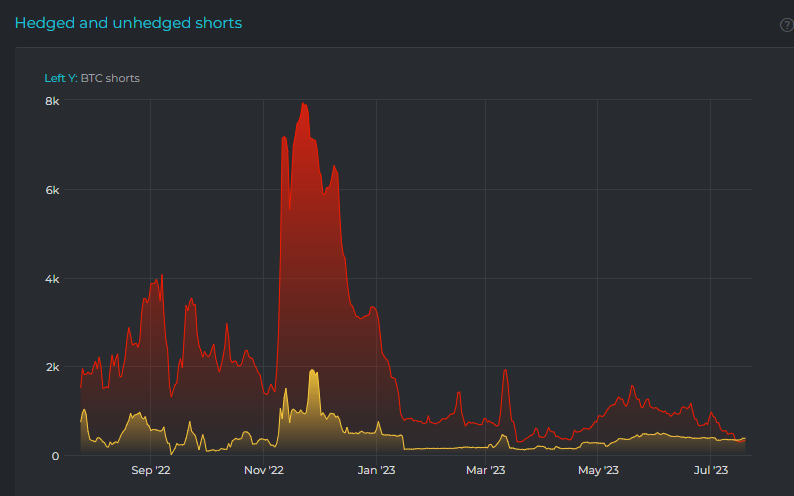
Diving into the complex world of Bitcoin (BTC) shorts, both hedged and unhedged, we are presented with an in-depth data visualization by Datamish, an in-depth look into the dynamics of hedged and unhedged Bitcoin (BTC) shorts. Here is a breakdown of what the chart illustrates:
- The yellow line represents the quantity of BTC shorts confirmed to be hedged.
- The red line illustrates the volume of unhedged BTC shorts or, to be more precise, not verifiably hedged.
Datamish calculates shorts by adding hedged and unhedged shorts to calculate the total volume.
There might be instances where a significant and sudden drop in the overall volume of shorts is observed that does not result in a consequential effect on the price. This might be perplexing, considering the completion of a trade typically follows the closing of a short position.
However, the rationale behind this is closing a hedged short position. This signifies that the trader who closed the position didn’t have to enter the market to buy coverage when the position was closed, as defined by Datamish.
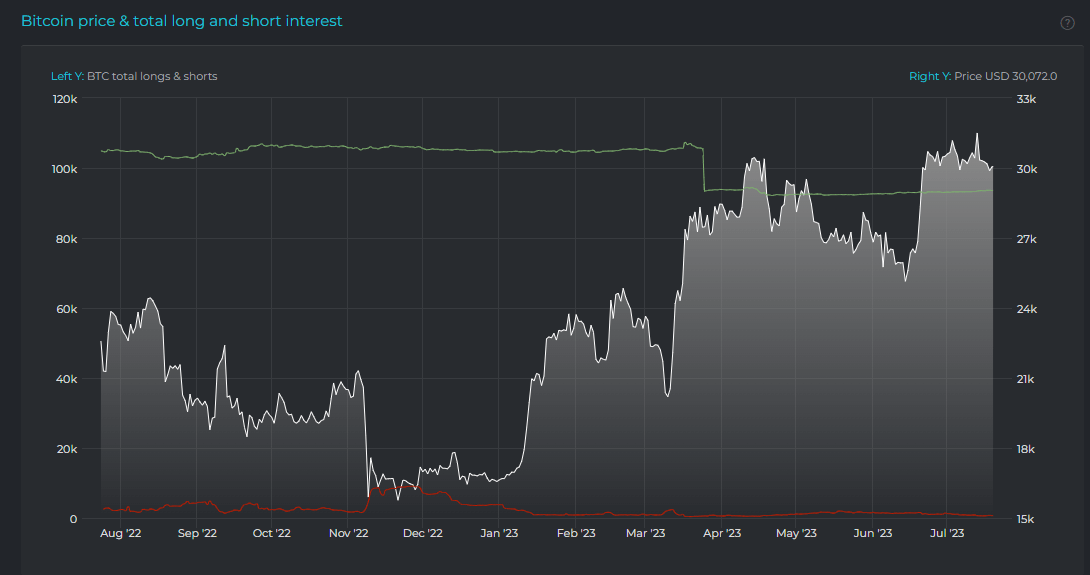
As of the current year-to-date data, the combined total of shorts is at a low of 696, consistently diminishing throughout the past year. On the other hand, the sum of longs is approximately 93,581.
This can be perceived positively as investors exhibit reduced risk behavior towards shorting Bitcoin or don’t foresee a significant downside. Moreover, hedged shorts have surpassed unhedged shorts, demonstrating that investors are removing risk from their trading decisions.


The post Exploring Bitcoin’s hedged and unhedged shorts dynamics appeared first on CryptoSlate.


