While the launch of spot Bitcoin ETFs in the U.S. put Bitcoin under the spotlight, focusing solely on its price movements provides an overly simplified, shallow representation of the market. It’s important to analyze Bitcoin in the context of other assets — both crypto and traditional.
Bitcoin’s relationship with Ethereum has always been meaningful. The interplay between the two largest cryptocurrencies often shows subtle market tendencies that aren’t clearly visible in price action.
The ETH/BTC ratio represents the relationship between the two by showing the value of one Ethereum in terms of Bitcoin. An increase in the ratio suggests Ethereum’s rising dominance or Bitcoin’s comparative weakness, while a decrease points to Ethereum’s underperformance against Bitcoin.
Previous CryptoSlate analysis showed that despite the significant short-term spikes and drops in the ratio, its overall volatility, measured by the standard deviation of its historical closing prices, has always been relatively moderate. This means that in the long term, BTC and ETH typically mirror each other’s movements and experience parallel market trends. However, that doesn’t mean that short-term volatility of the ratio should be dismissed.
When both experience similar bullish or bearish trends, their ratio maintains equilibrium, further highlighting the importance of short-term discrepancies in their movement.
Since October 2022, the ETH/BTC has been in a downturn, most likely due to a market correction following the high expectations set by the Merge. It also shows that Ethereum’s price movements were not as pronounced as Bitcoin’s, leading to decreased relative value seen through the ratio.
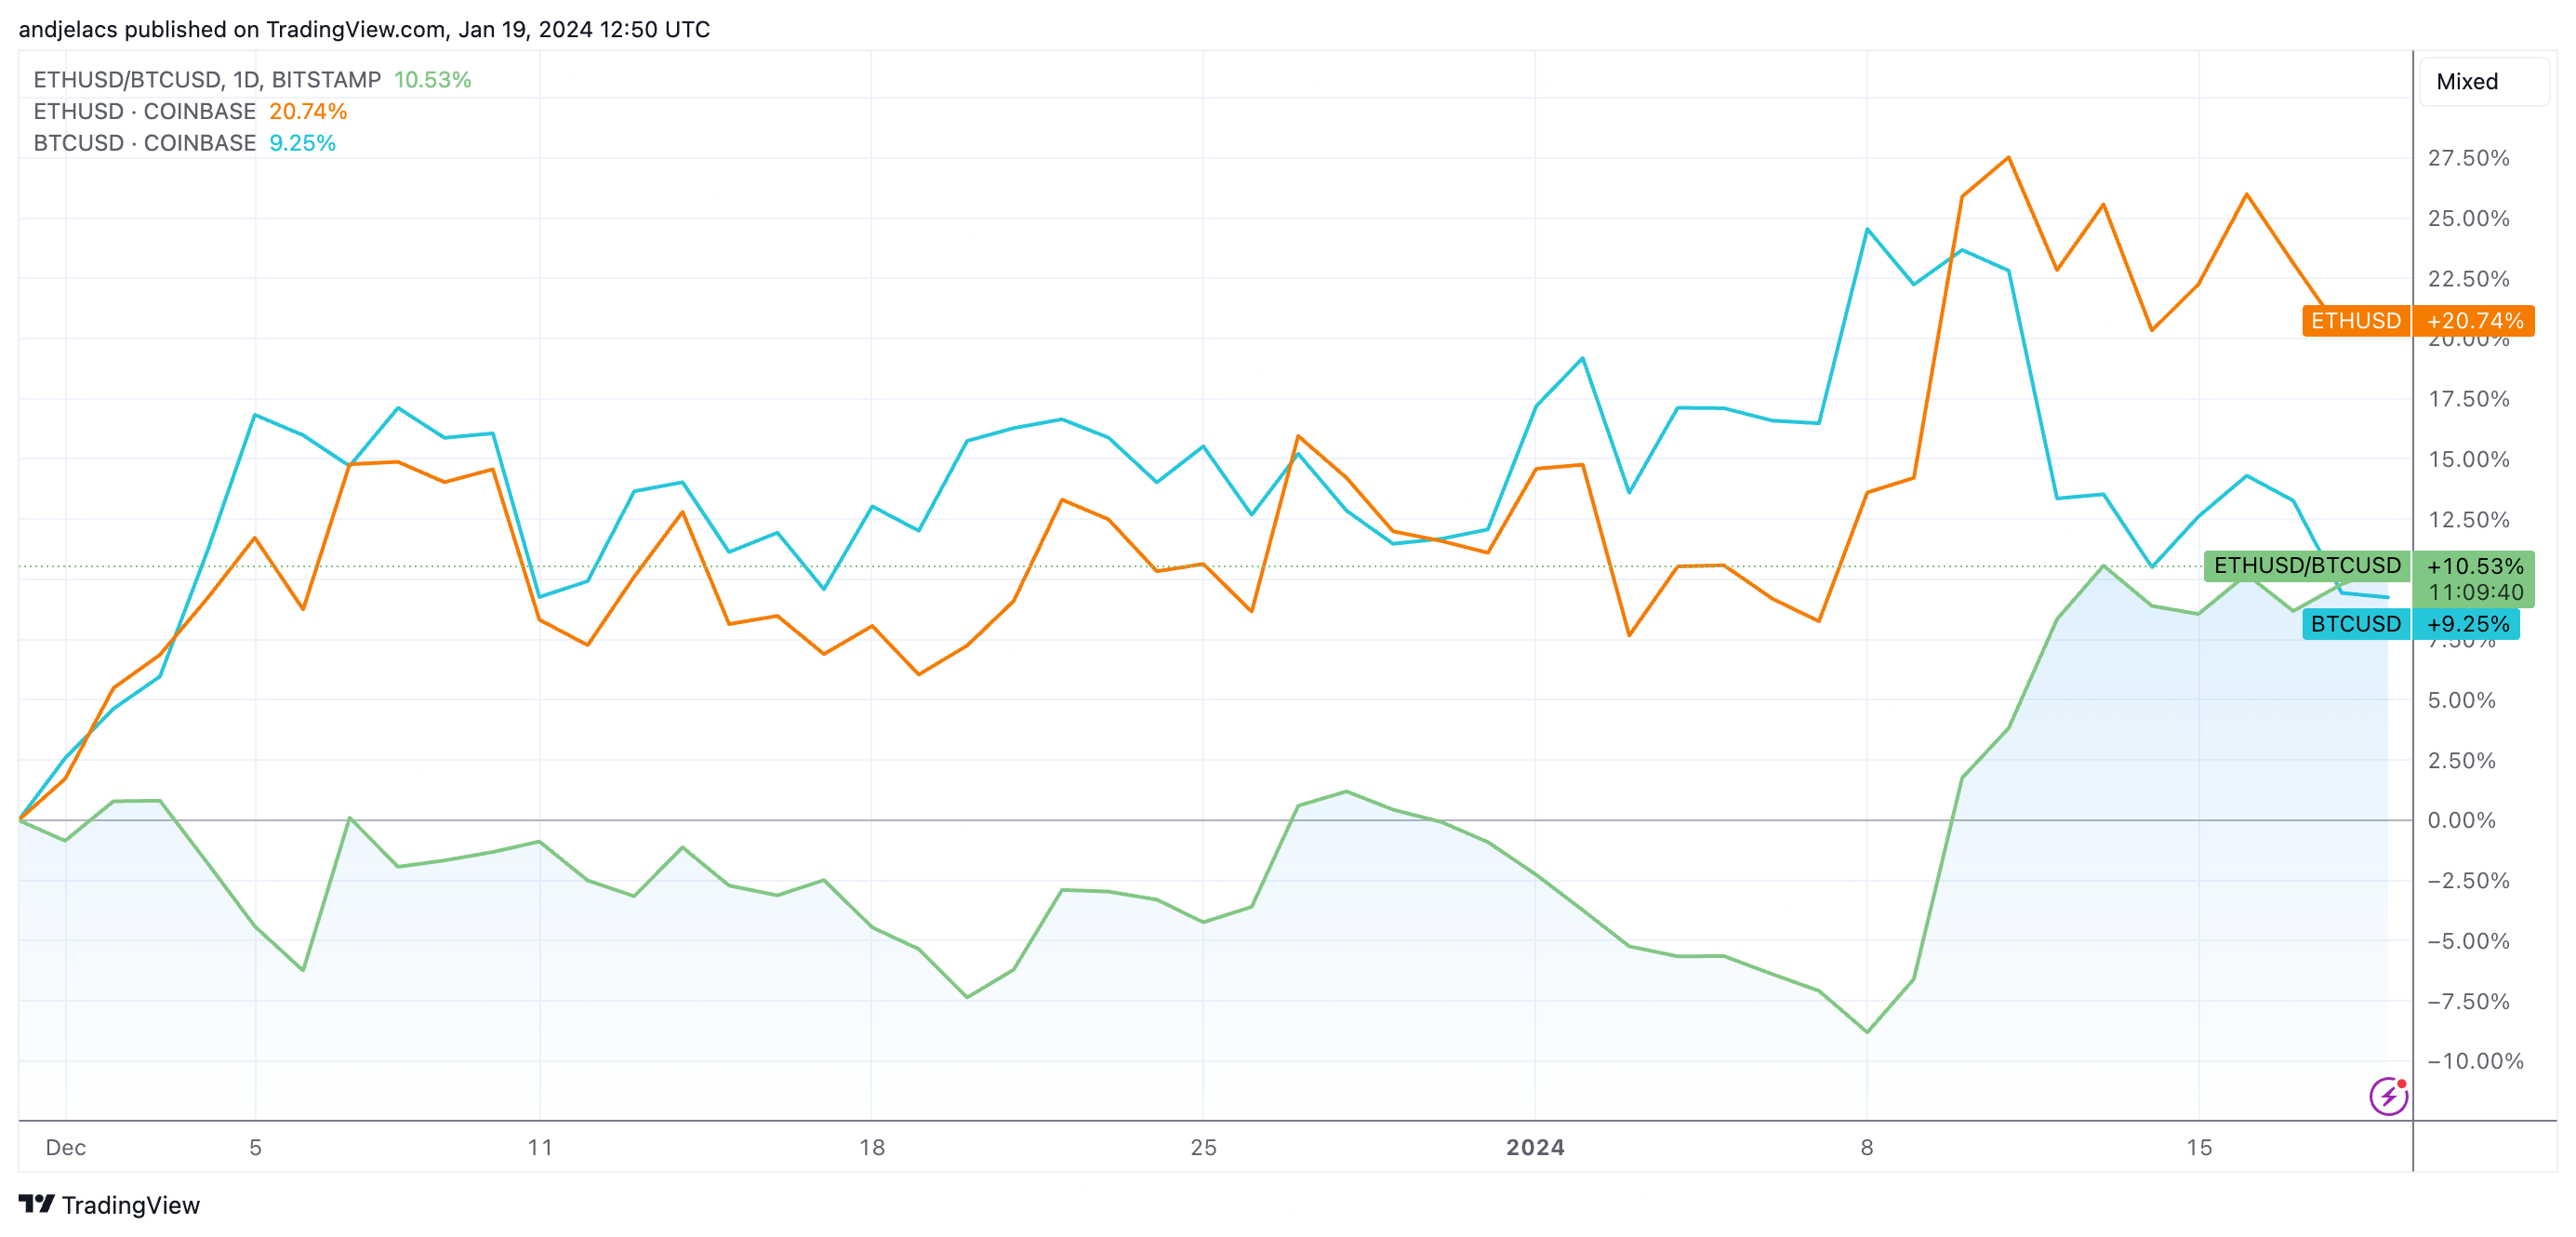
Since CryptoSlate reported on the ratio, it has experienced a swift and notable trend reversal. Between Nov. 30, 2023, and Jan. 19, 2024, the ETH/BTC ratio increased by 10.53%. During this period, the price of ETH in USD increased by 20.74%, while BTC increased by 9.25%. Ethereum’s transaction volume increased by 4.59%, and Bitcoin’s grew by 27.23%.

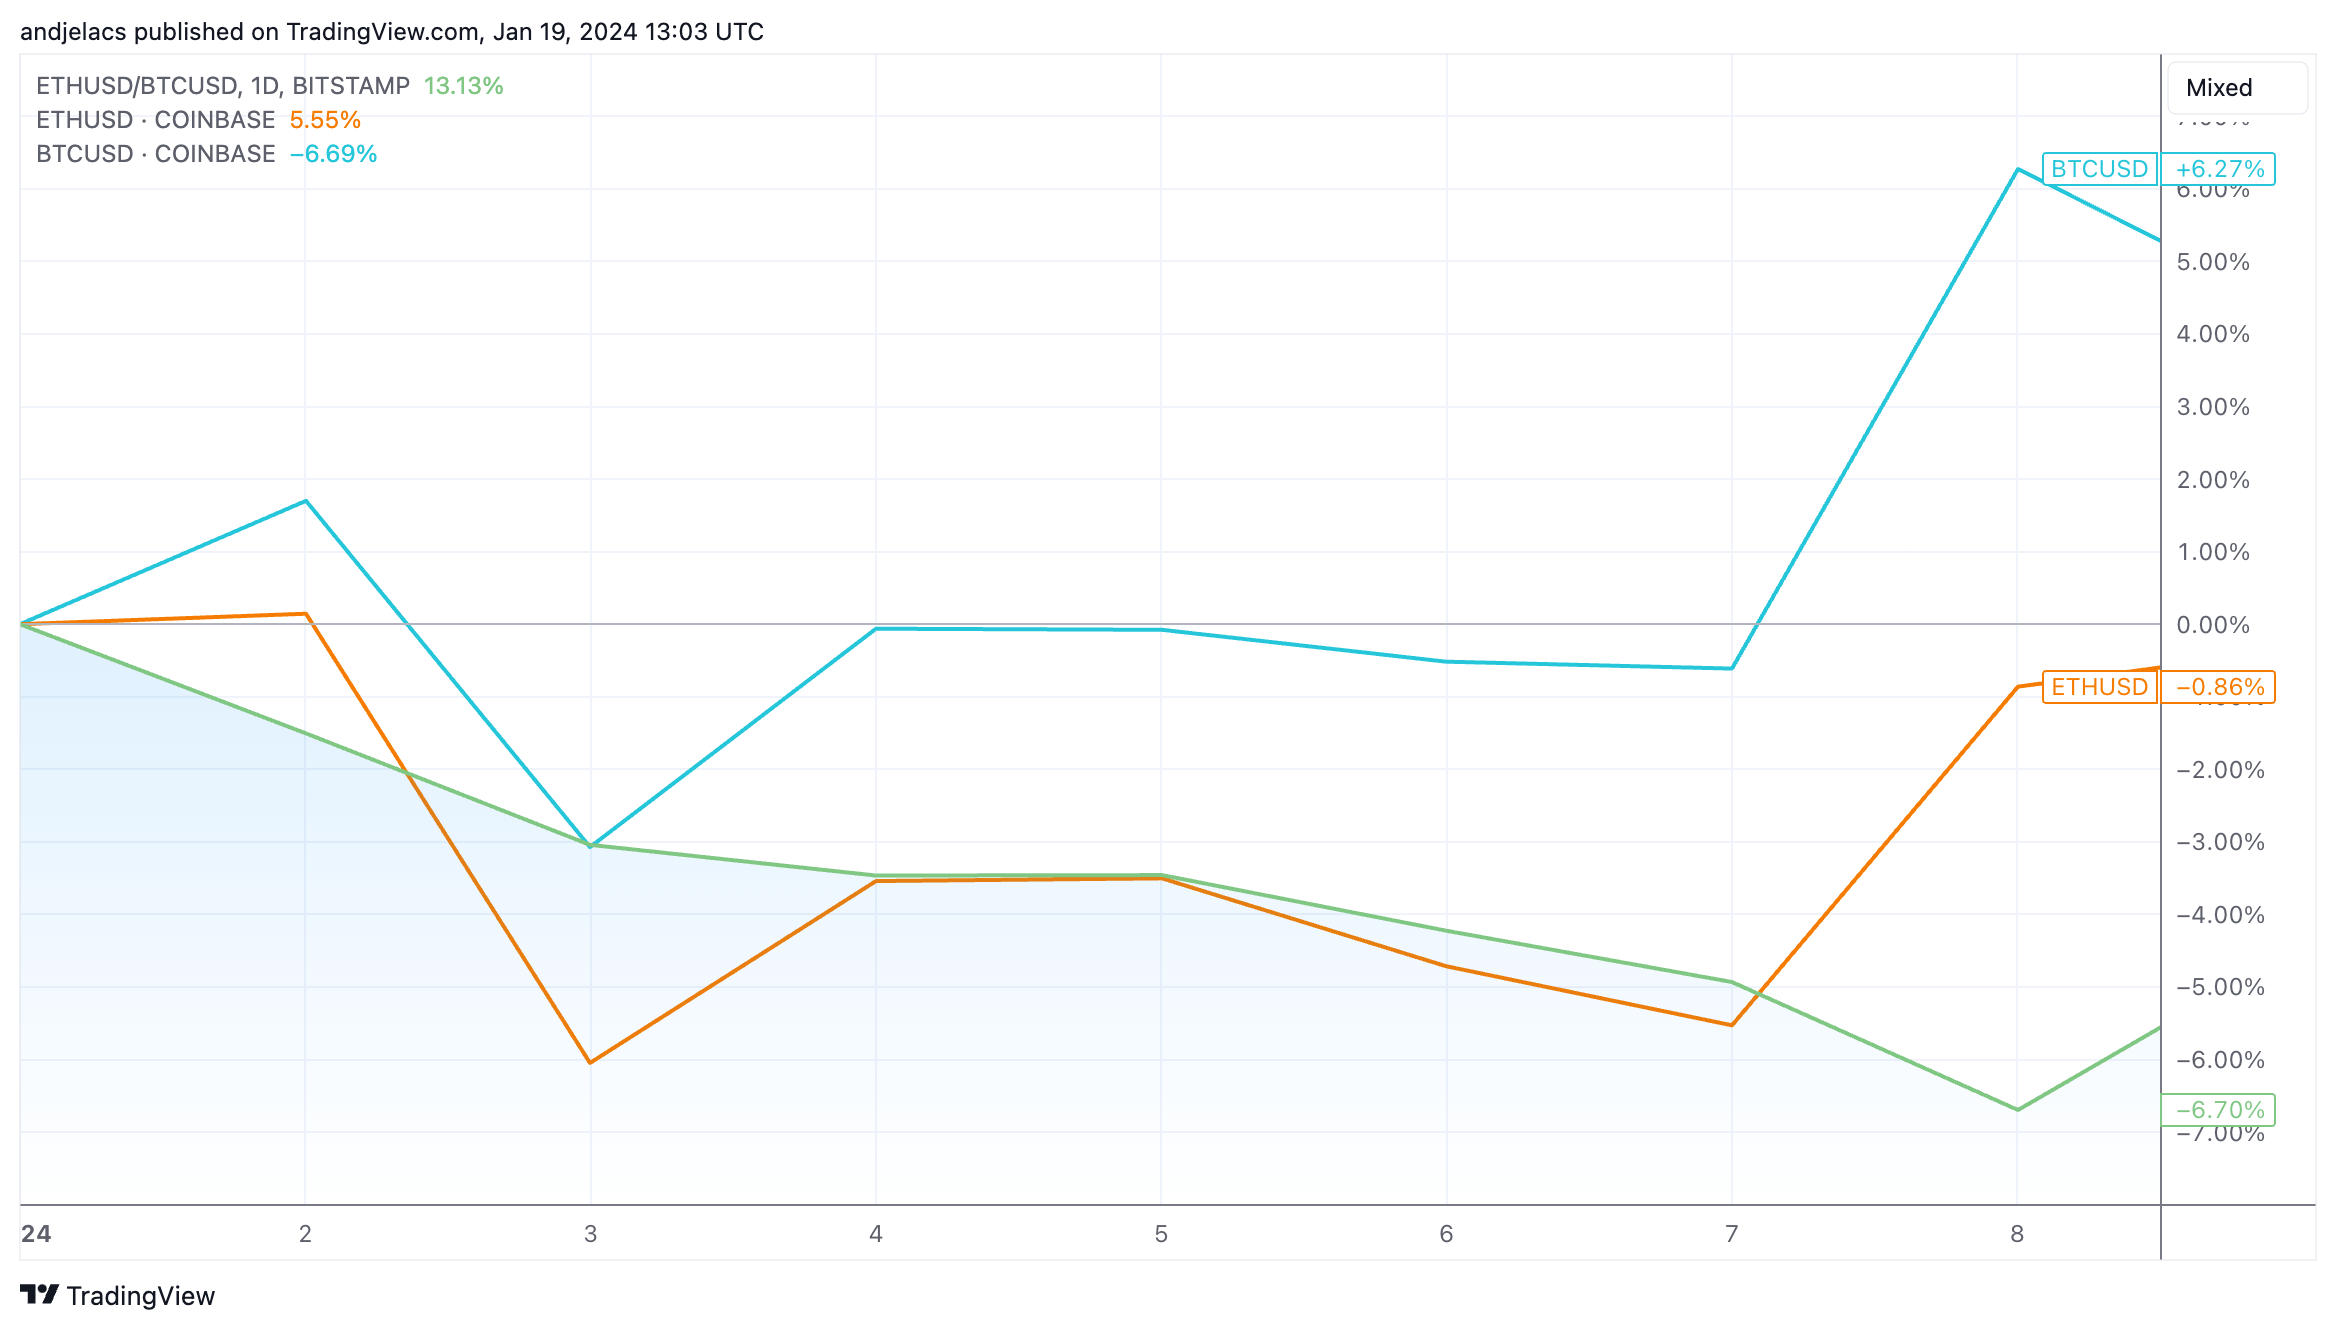
The positive price momentum and volume increase continued into 2024. The new year began with the market eagerly awaiting the approval of the spot ETFs in the U.S., the anticipation causing tension and pushing prices higher. The ETH/BTC ratio decreased significantly between Jan. 1 and Jan. 8, with Bitcoin’s price increase pushing the ratio down by 6.70%.

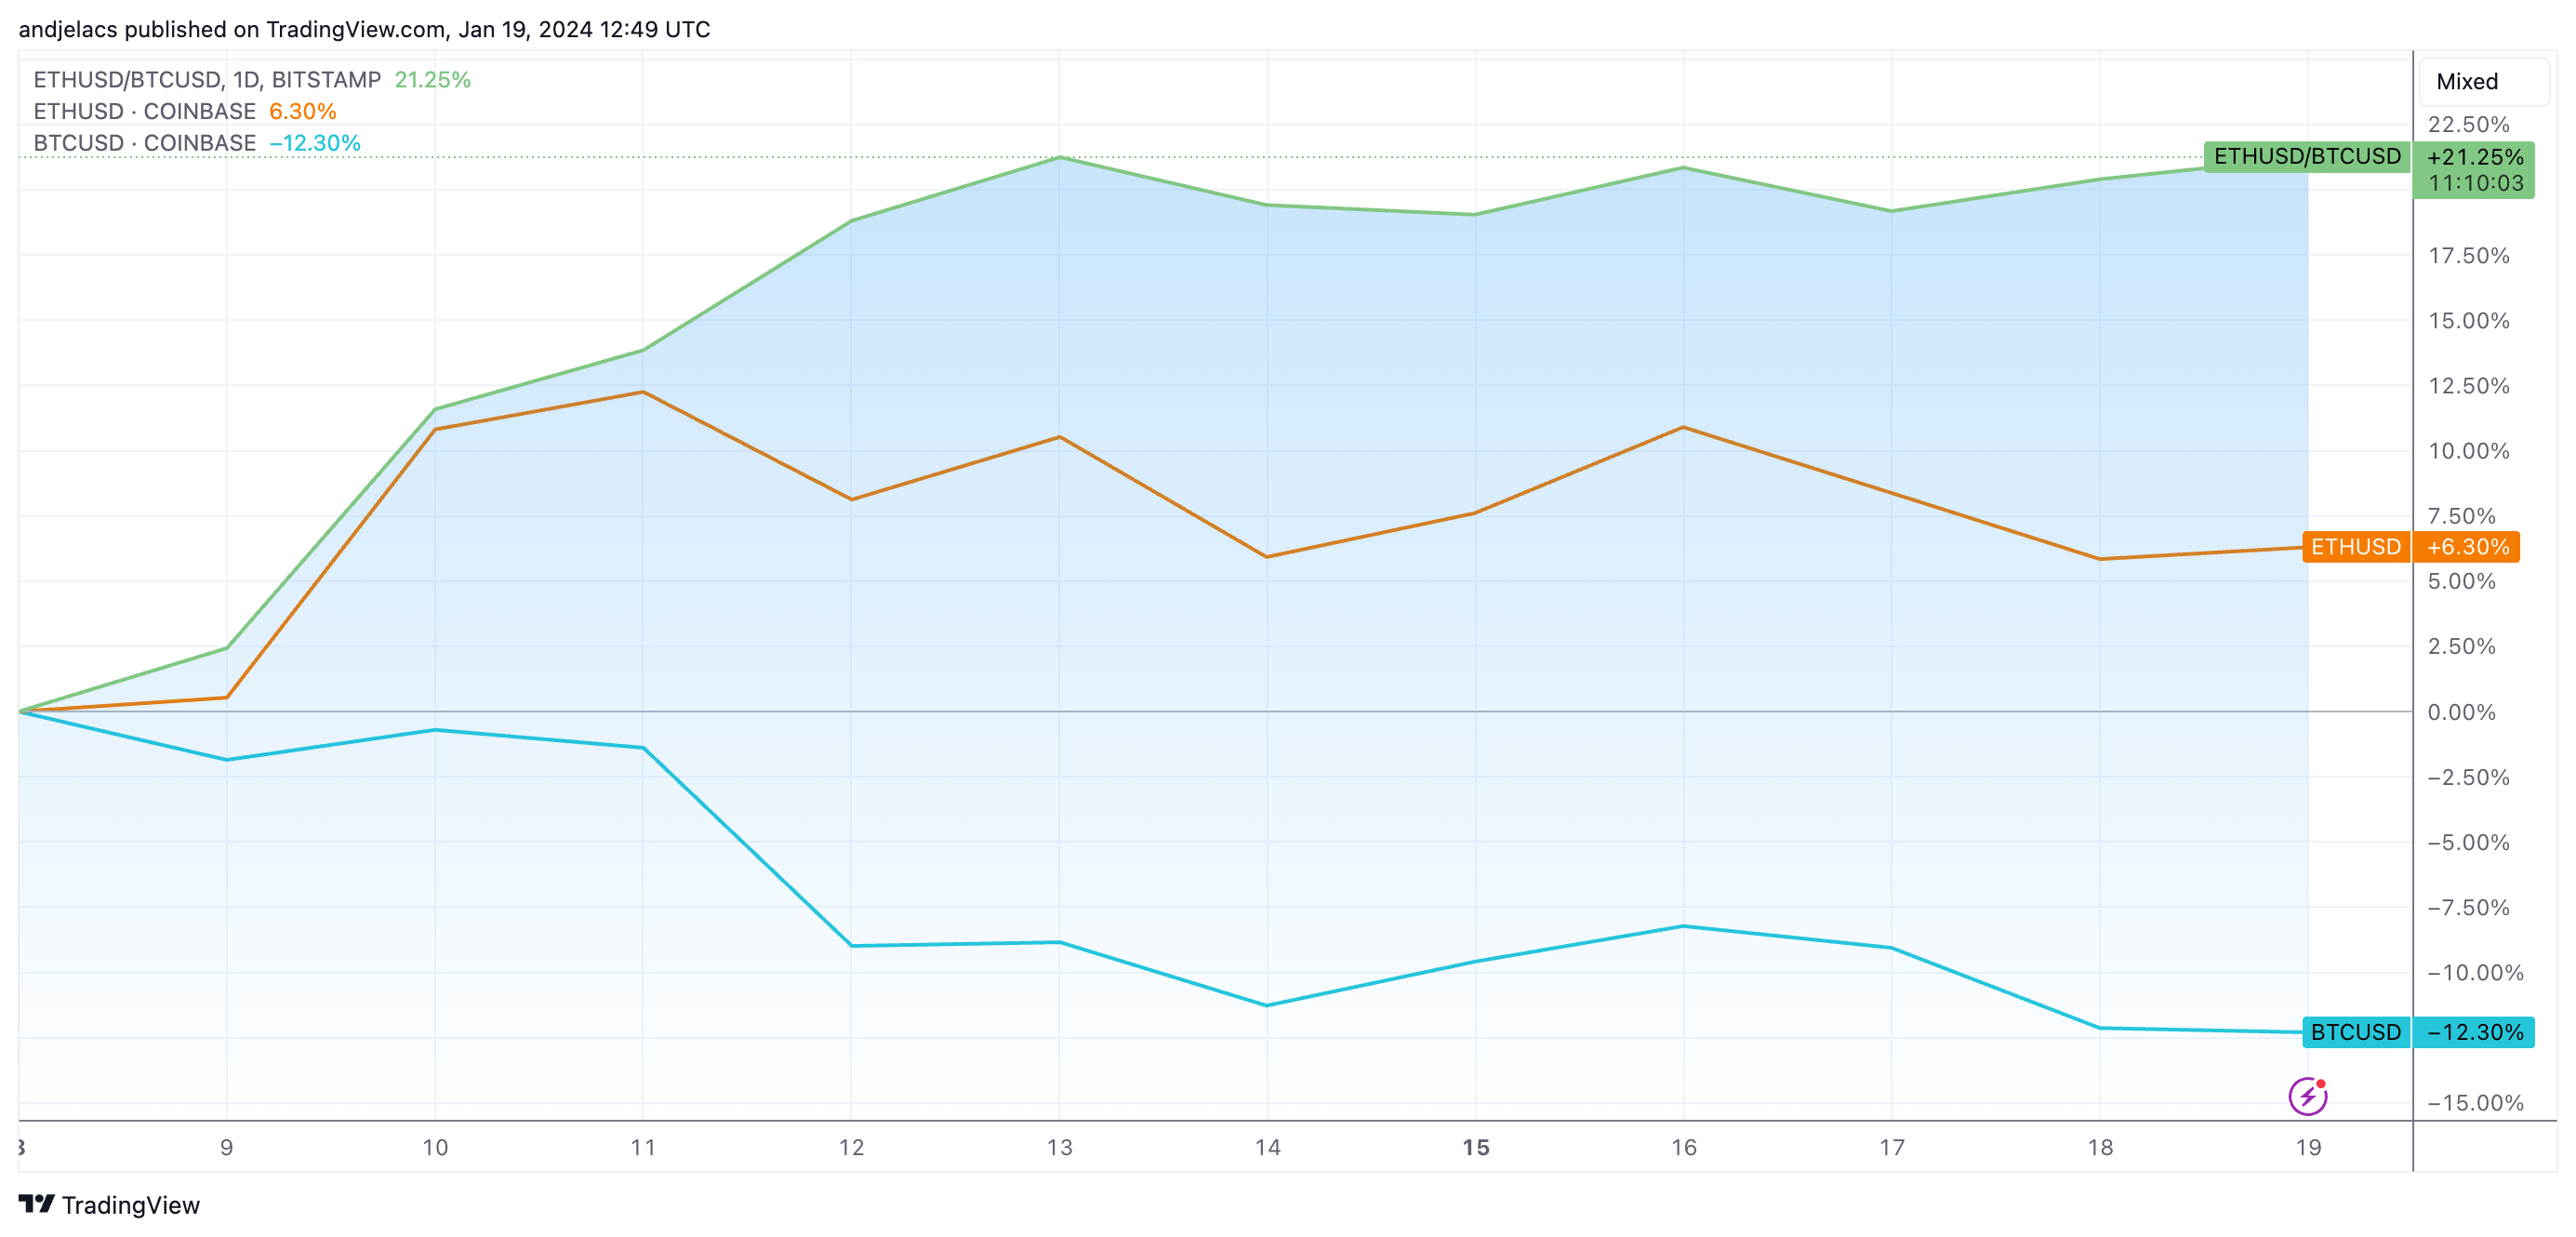
However, as the approval of the ETFs became imminent on Jan. 8, the market began correcting from the tension that built up Bitcoin’s price. Ethereum’s price saw a rebound, and Bitcoin experienced a notable decrease.
Between Jan. 8 and Jan. 19, Bitcoin’s price decreased by 12.30%, as the launch of the ETFs failed to provide the rally the market anticipated. At least some of the capital that exited Bitcoin seems to have relocated to Ethereum, as ETH saw its price jump by 6.30%. This discrepancy in price increases led to a sharp increase in the ETH/BTC ratio, which grew by 21.25%.

This divergence in price trajectories would suggest an increase in trading volume for Ethereum, as a jump would usually follow the price increase in buying and selling activities on exchanges. However, Ethereum’s transaction volume decreased by 4.15% during the period. On the other hand, Bitcoin’s transaction volume increased by almost 34%.
This suggests that Bitcoin’s price decline can’t be attributed solely to diminishing market interest. Institutional movements, likely spurred by the ETF approvals and the subsequent spike in ETF inflows and trading volume, most likely caused the increase in transaction volume. At the same time, retail selling pushed the price down.
The lack of structured Ethereum-based trading products implies that the recent ETH spike potentially originated from retail activity. Conversely, Bitcoin’s market response seems more driven by institutional movements, showing the impact of spot ETFs on both crypto and traditional financial markets.
The post Ethereum outpaces Bitcoin post-ETF launch as ETH/BTC ratio skyrockets appeared first on CryptoSlate.


