Quick Take
When assessing the performance of assets or currencies, it is essential to consider both nominal and real returns, the latter of which accounts for inflation. Inflation can be gauged through different metrics, such as the consumer price index (CPI) or indicators related to the money supply (e.g., M2). While the money supply is not a direct measure of inflation, it can play a role in shaping it. However, when evaluating an asset’s performance in a local currency, such as the British Pound (GBP), it is often useful to benchmark it against the US Dollar.

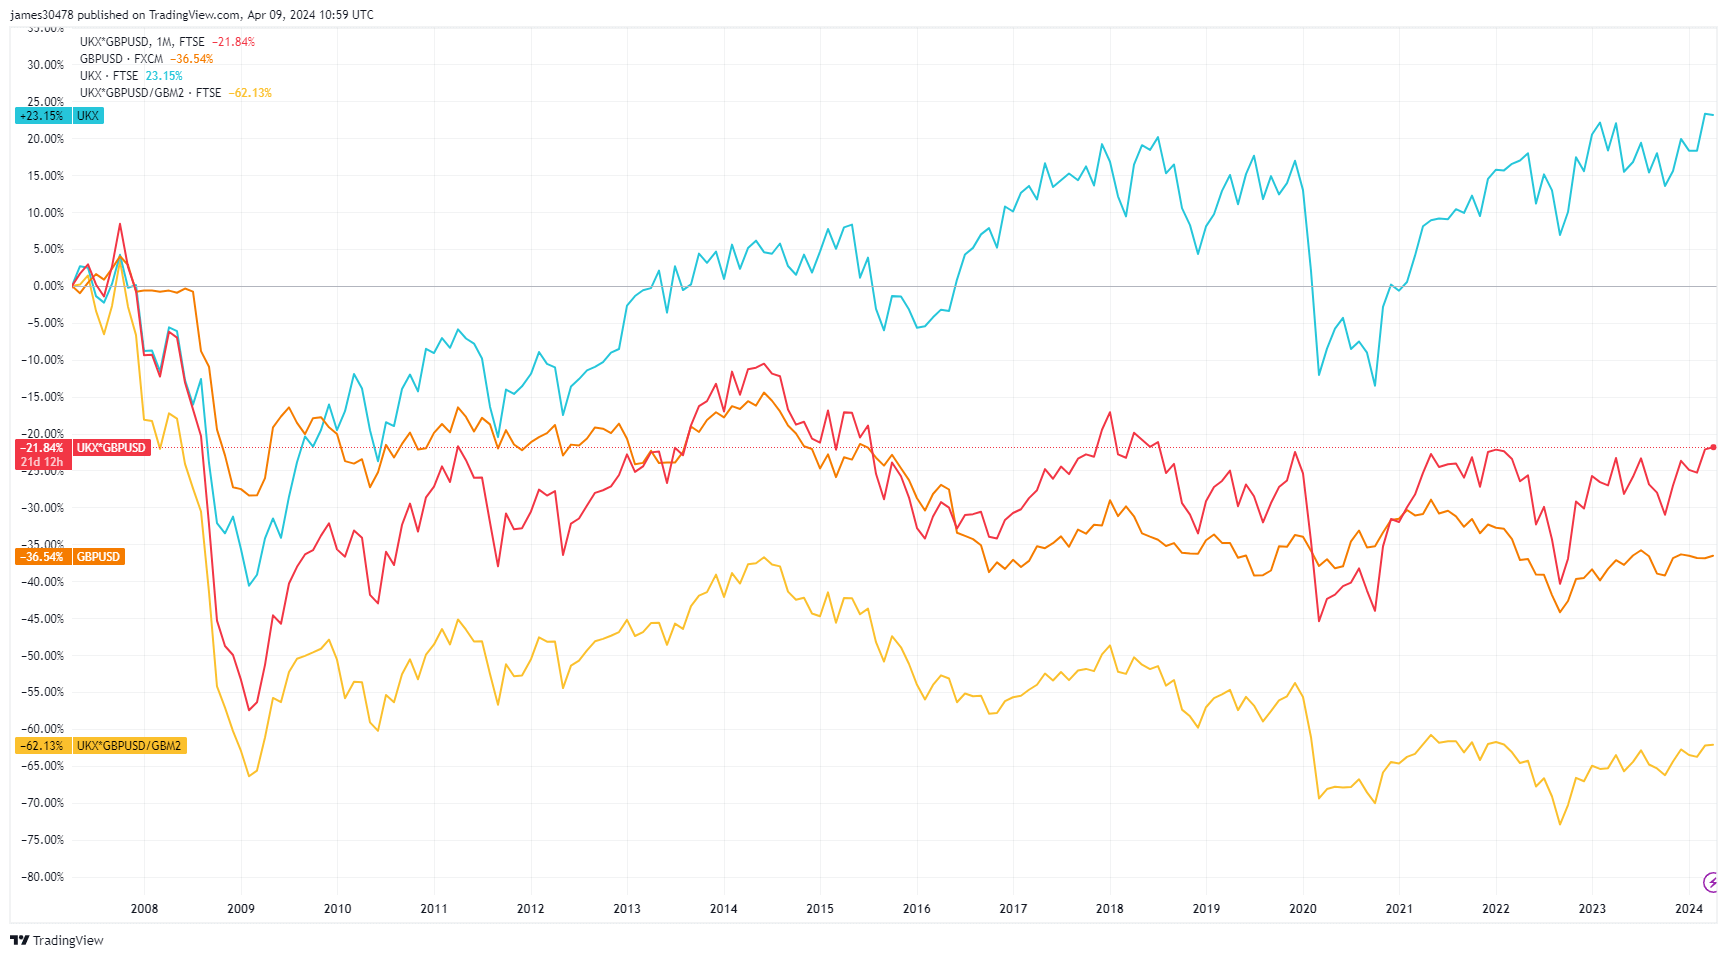
A prime example is the FTSE 100, which has risen approximately 23% since 2007 and recently achieved an all-time high, surpassing 8,000 in GBP terms. At first glance, this may appear impressive. However, when converted to US Dollars, the FTSE 100 has actually declined by 22% over the same period, while the GBP has fallen 37% against the Dollar. The situation becomes even more alarming when measured against the UK’s M2 money supply, revealing a staggering 62% decrease.
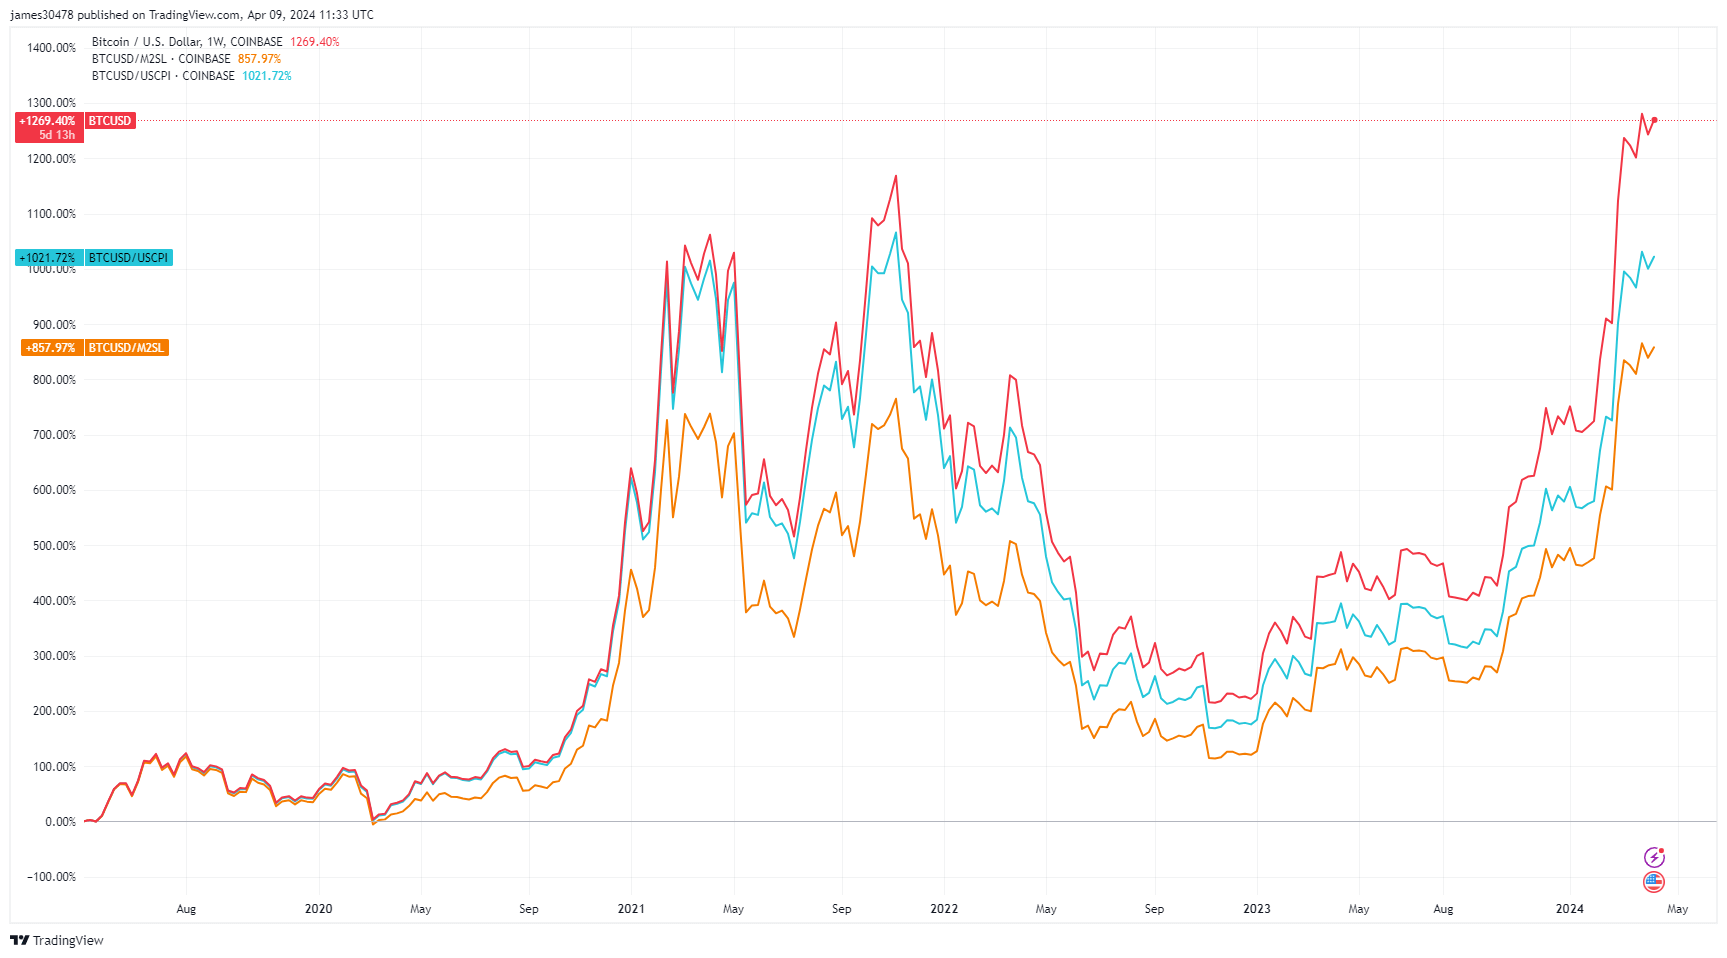
Bitcoin, over its historical trajectory benchmarked in USD, has consistently surged to new highs with each cycle, surpassing a remarkable 1200% increase in the past five years. Furthermore, it has demonstrated the capacity to outperform the M2 money supply and is nearing record highs relative to the US Consumer Price Index (CPI).

To gain a comprehensive understanding of an asset’s true performance, I believe it should first be converted into US Dollars (if measured in a local currency) and then adjusted for local CPI inflation and money supply changes. This approach provides a more accurate and holistic view of the asset’s real value and performance over time.
The post FTSE 100’s illusion of growth unmasked by currency and inflation adjustments appeared first on CryptoSlate.


