Quick Take
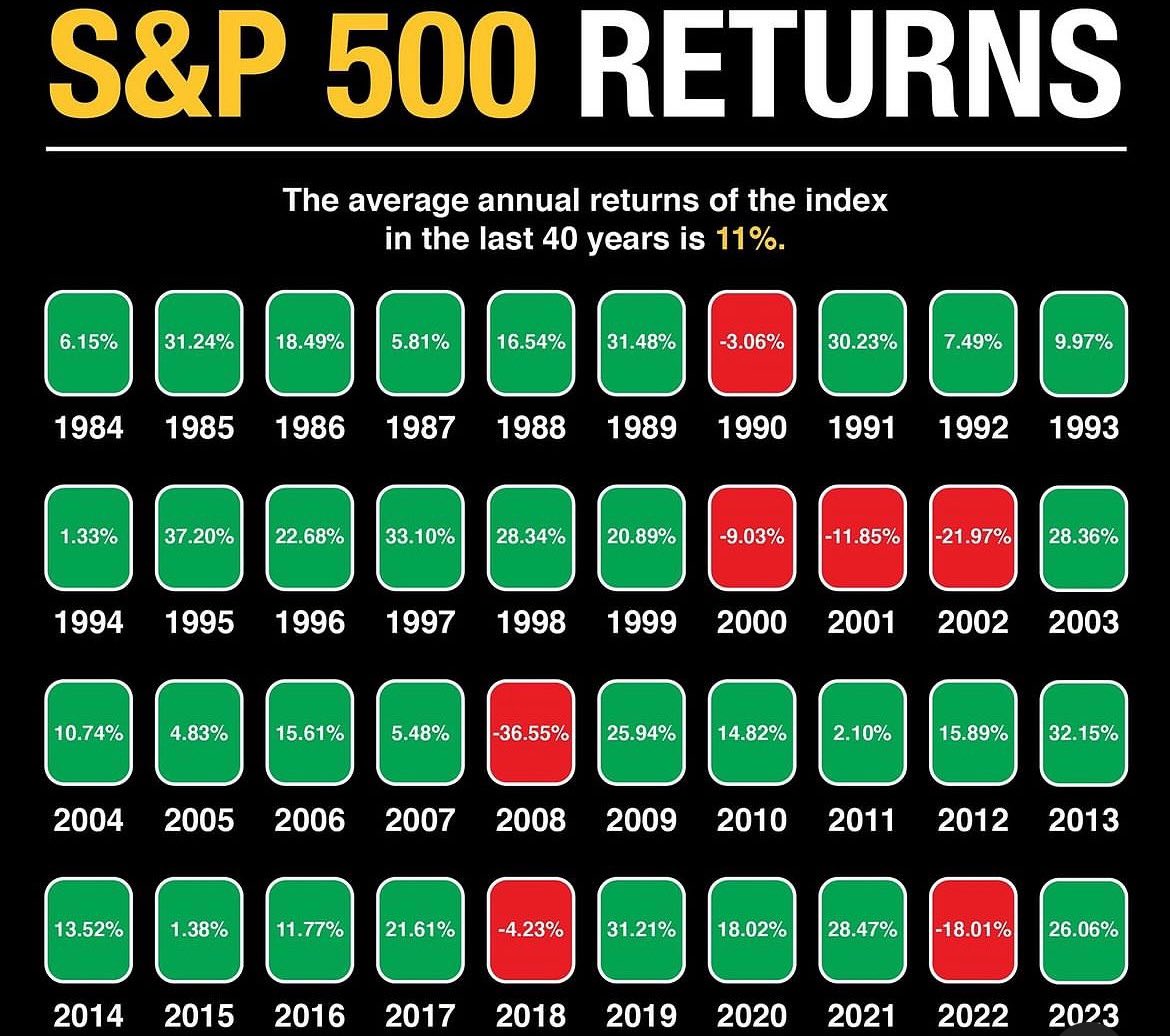
Data compiled by an anonymous X account, dividendology. Over the past 40 years, the S&P 500 has averaged an 11% annual return. Despite experiencing drawdowns in just seven years—1990, 2000, 2001, 2002, 2008, 2018, and 2022—the index has delivered impressive gains, with the best years exceeding 30% returns, notably in 1985, 1989, 1991, 1995, 1997, 2013, and 2019. In 2024, the S&P 500 is up 11%, aligning with its historical average.

Comparatively, Bitcoin has shown remarkable growth since 2014, with a compound annual growth rate (CAGR) of 63%. Despite negative performances in 2014 (-56%), 2018 (-73%), and 2022 (-64%), Bitcoin’s significant yearly gains, such as an over 1300% surge in 2017, have far outweighed these losses. In 2024, Bitcoin’s growth continues to match its historical CAGR, according to Glassnode data.
| year | annual_return |
|---|---|
| 2014 | -56% |
| 2015 | 34% |
| 2016 | 125% |
| 2017 | 1336% |
| 2018 | -73% |
| 2019 | 92% |
| 2020 | 303% |
| 2021 | 60% |
| 2022 | -64% |
| 2023 | 155% |
| 2024 | 63% |
| CAGR | 63% |
Source: Glassnode
When evaluating both Bitcoin and the S&P 500 against CPI inflation and the M2 money supply increase since 2014, Bitcoin’s performance is extraordinary. While CPI inflation has risen by 34% and the M2 money supply by 78%, the S&P 500 has surged by 156%. However, Bitcoin outshines both, with an astounding increase of over 23,000% since 2014, demonstrating its unparalleled appreciation in value over the past decade.

The post Bitcoin’s 2024 growth upholds an extraordinary 63% CAGR appeared first on CryptoSlate.


