Onchain Highlights
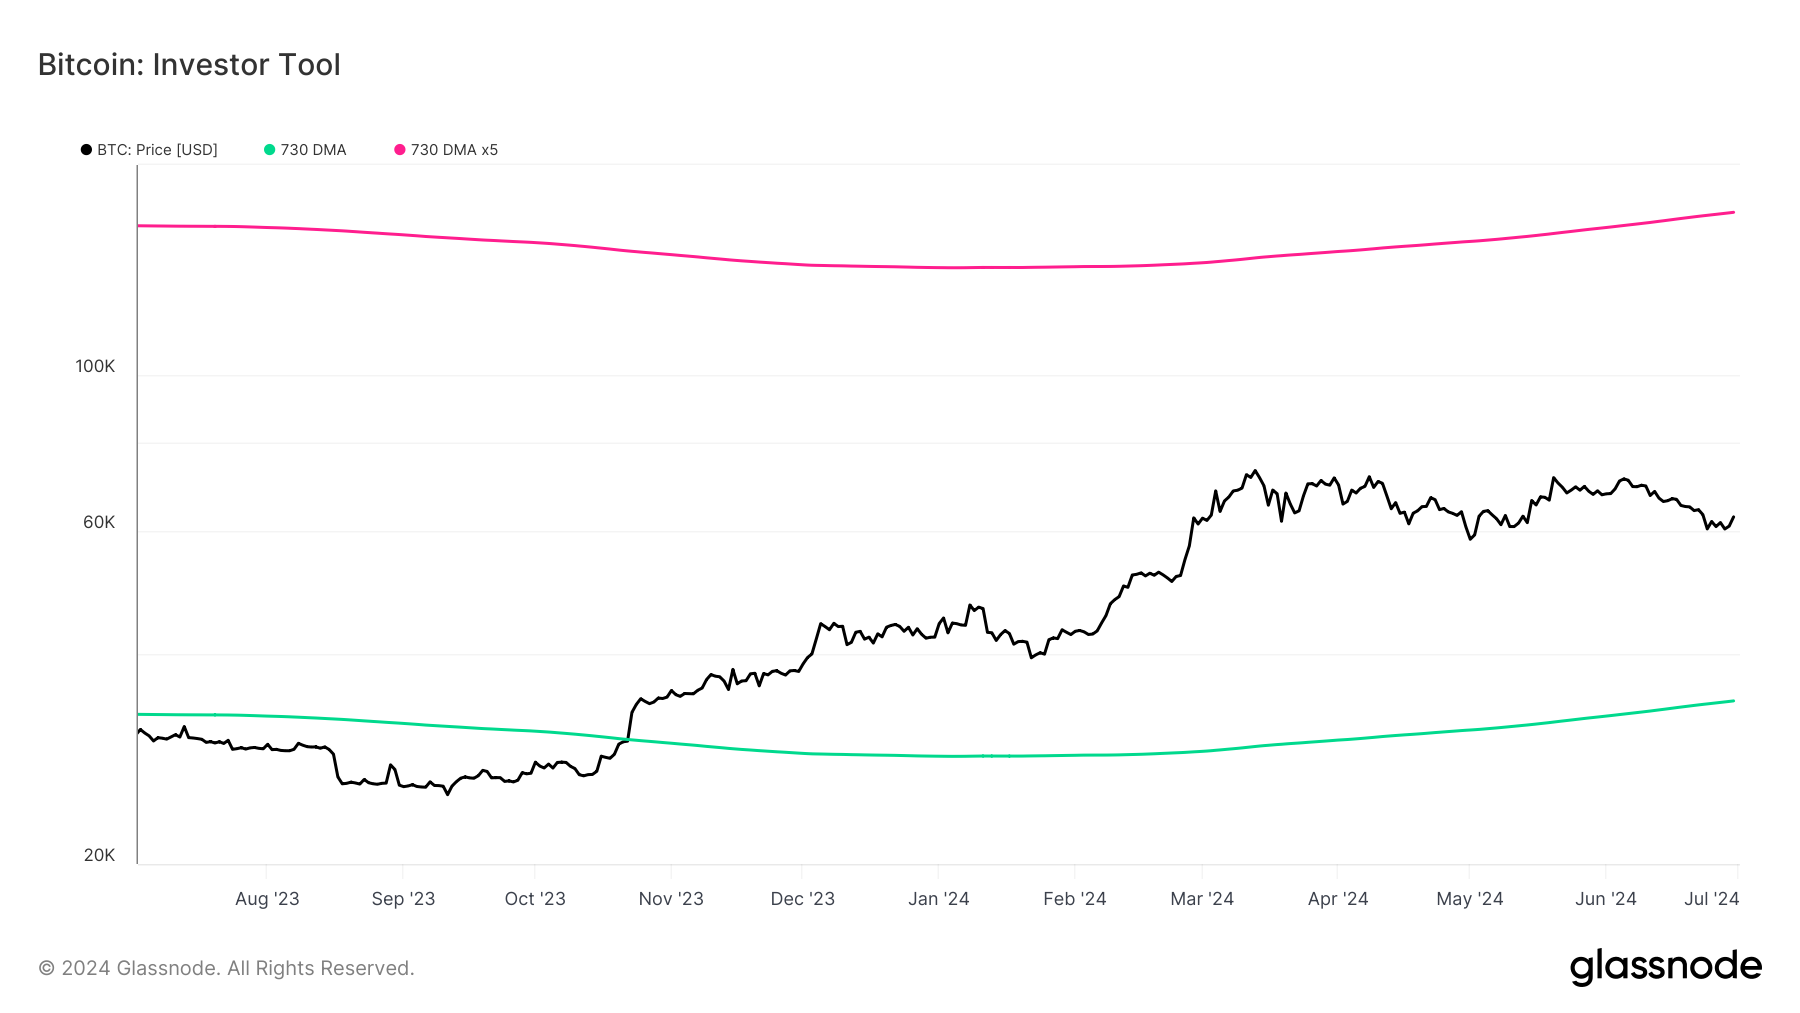
DEFINITION: The Investor Tool is intended as a tool for long-term holders, indicating periods when prices are likely approaching cyclical tops or bottoms. The tool uses two simple moving averages of price as the basis for under/overvalued conditions: the 2-year MA (green) and a 5x multiple of the 2-year MA (red).
Price trading below the 2-year MA has historically generated outsized returns, and signalled bear cycle lows. Price trading above the 2-year MA x5 has historically signaled bull cycle tops and a zone where investors de-risk.
Since November 2023, Bitcoin’s price has fluctuated within key moving averages, reflecting its cyclical nature. Glassnode’s Investor Tool illustrates Bitcoin’s price movement relative to its 2-year simple moving average (SMA) and a 5x multiple of the 2-year SMA. Historically, the 2-year SMA has served as a support level during bear markets, while the 5x multiple has indicated potential market tops where investors might de-risk.

Bitcoin’s price has remained above the 2-year SMA throughout 2024, suggesting a phase of market strength. However, it is still below the 5x multiple, indicating room for potential growth before reaching a historical de-risking zone. This alignment suggests that the current market might not yet be at a cyclical peak.
Previous cycles, as shown in the chart below, show that maintaining positions above the 2-year SMA has correlated with periods of significant price appreciation. Investors are likely to monitor these indicators closely to gauge optimal entry and exit points in the market. Bitcoin’s persistence above the 2-year SMA reinforces the ongoing bullish sentiment, while the space below the 5x multiple suggests cautious optimism among market participants.

The post Bitcoin remains above 2-year SMA, suggesting growth potential appeared first on CryptoSlate.


