Onchain Highlights
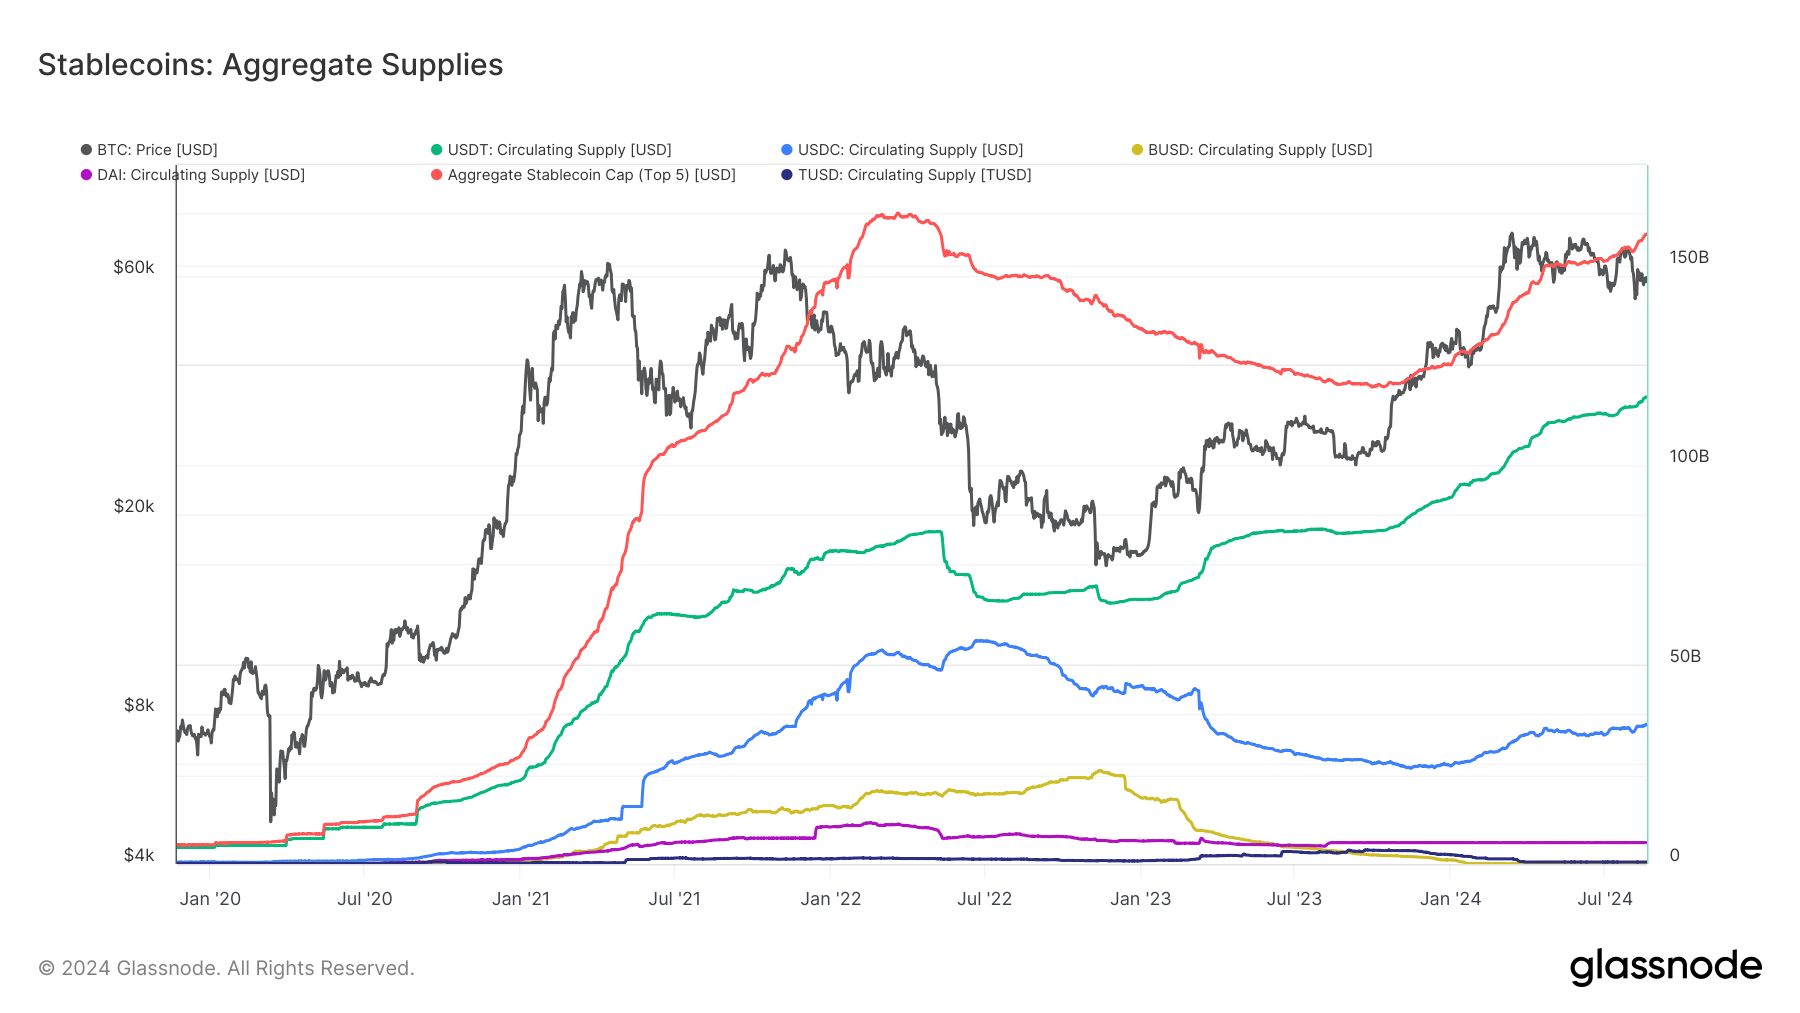
DEFINITION: This chart shows the aggregate valuation  of the top five stablecoins USDT
  , USDC
  , BUSD
  , DAI
, DAI  , TUSD
  . Note that the supplies of these stablecoins are distributed between multiple host blockchains, including Ethereum.
Bitcoin’s market dynamics have remained closely linked to the trends observed in stablecoin supplies since 2020. The aggregate stablecoin market cap, driven by the top five stablecoins, saw rapid expansion from mid-2020 through 2021, corresponding with Bitcoin’s significant price rallies during the same period.
This surge in stablecoin issuance, particularly from USDT and USDC, provided substantial liquidity, fueling Bitcoin’s rise to new all-time highs in 2021. However, following the peak in mid-2022, the aggregate market cap of these stablecoins began to decline, with notable contractions in USDC and BUSD supplies. Despite this, USDT maintained a dominant and relatively stable and increasing supply, reflecting its continued market preference.
Bitcoin’s price movements have shown a pattern of correlation with these aggregate trends, emphasizing the role stablecoins play in market liquidity. The evolving supply trends could be indicative of future shifts in Bitcoin’s price trajectory as the market matures.

The post Stablecoin supply changes highlight Bitcoin’s dependency on liquidity factors appeared first on CryptoSlate.


