Avalanche (AVAX) has experienced a bearish week with several price floors being lost. However, in the last 24 hours, AVAX has moved up by 1.5%, suggesting a sideways trading session. The technical analysis indicates that bears still have control over AVAX, with decreased demand and accumulation.
Buyers have lost interest due to previous bearish influence. Bitcoin’s price has been indecisive, losing the $27,000 price zone. Major altcoins have followed this trend. Although BTC has shown some recovery, overall market weakness has impacted buyer sentiment in the altcoin market.
AVAX is currently trading near a crucial support level, and further selling pressure could lead to significant value loss in upcoming trading sessions. Buyers need to intervene for the price to initiate a recovery.
The market capitalization of AVAX has also declined, indicating increased selling strength on the chart.
Avalanche Price Analysis: One-Day Chart

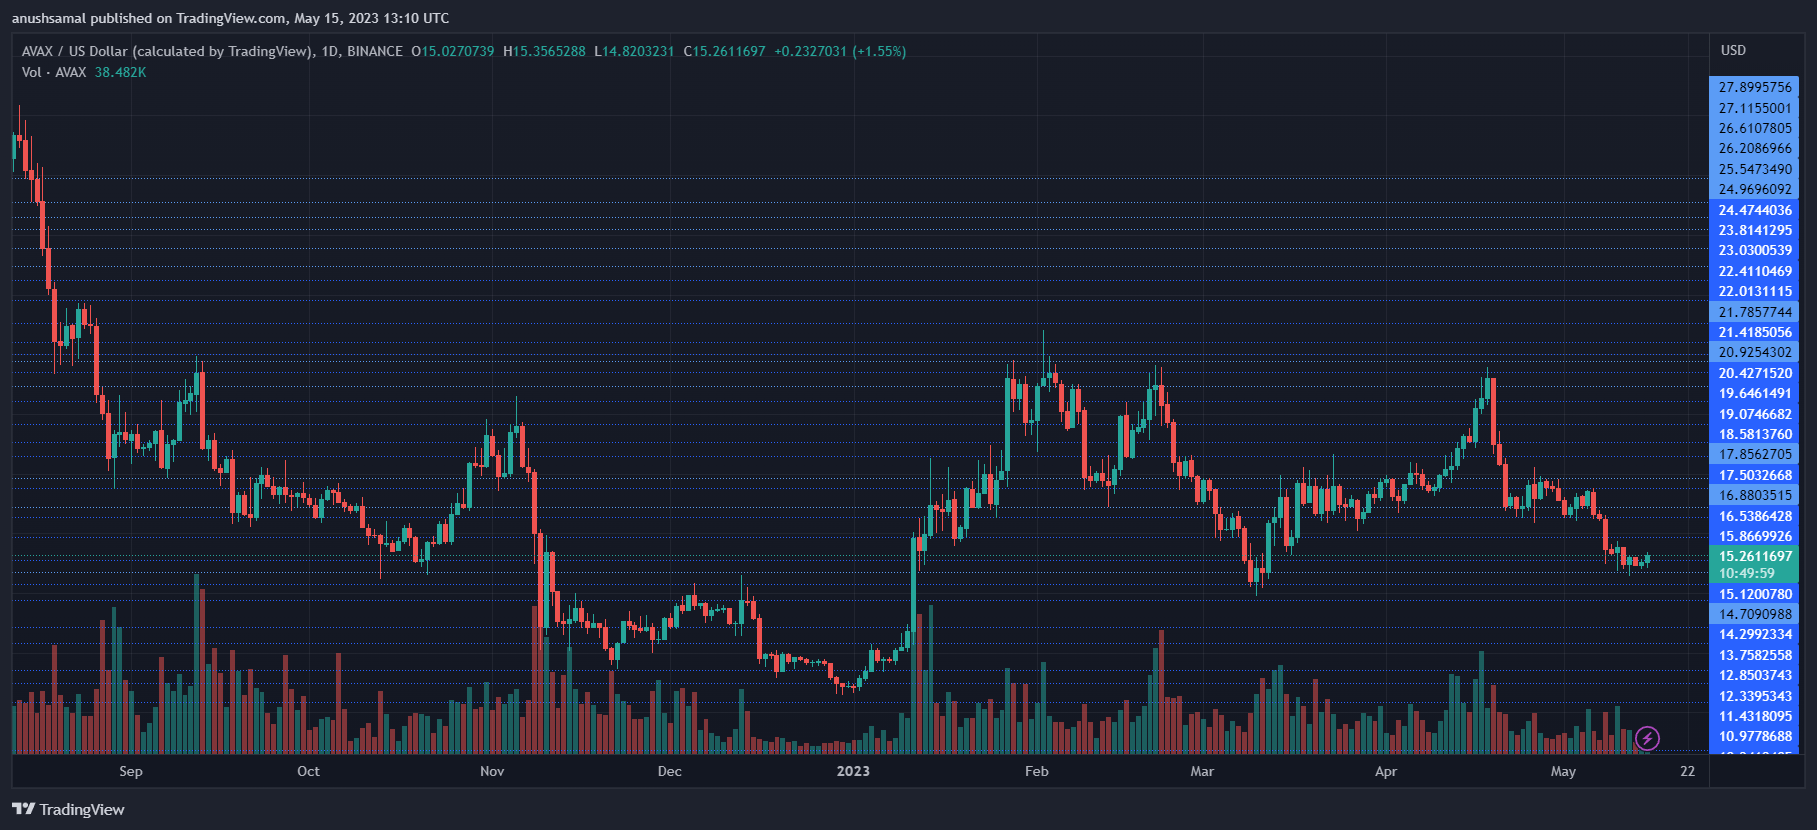
At the time of writing, AVAX was priced at $15.40. Following a modest recovery, AVAX has surpassed the $15 threshold and is now positioned near its critical support level of $14. The altcoin faces resistance at the $16 mark, and if it manages to surpass this level, it could potentially reach $18 and subsequently $20.
Crossing $16 would signal increased strength for the bulls. Conversely, a decline from the current level would push the coin below $15 and eventually toward $14, strengthening the bears.
With a slight uptick in demand, AVAX may make an attempt to breach the $16 threshold. The trading volume for AVAX in the previous session was relatively low, indicating a reduced presence of buyers in the market.
Technical Analysis

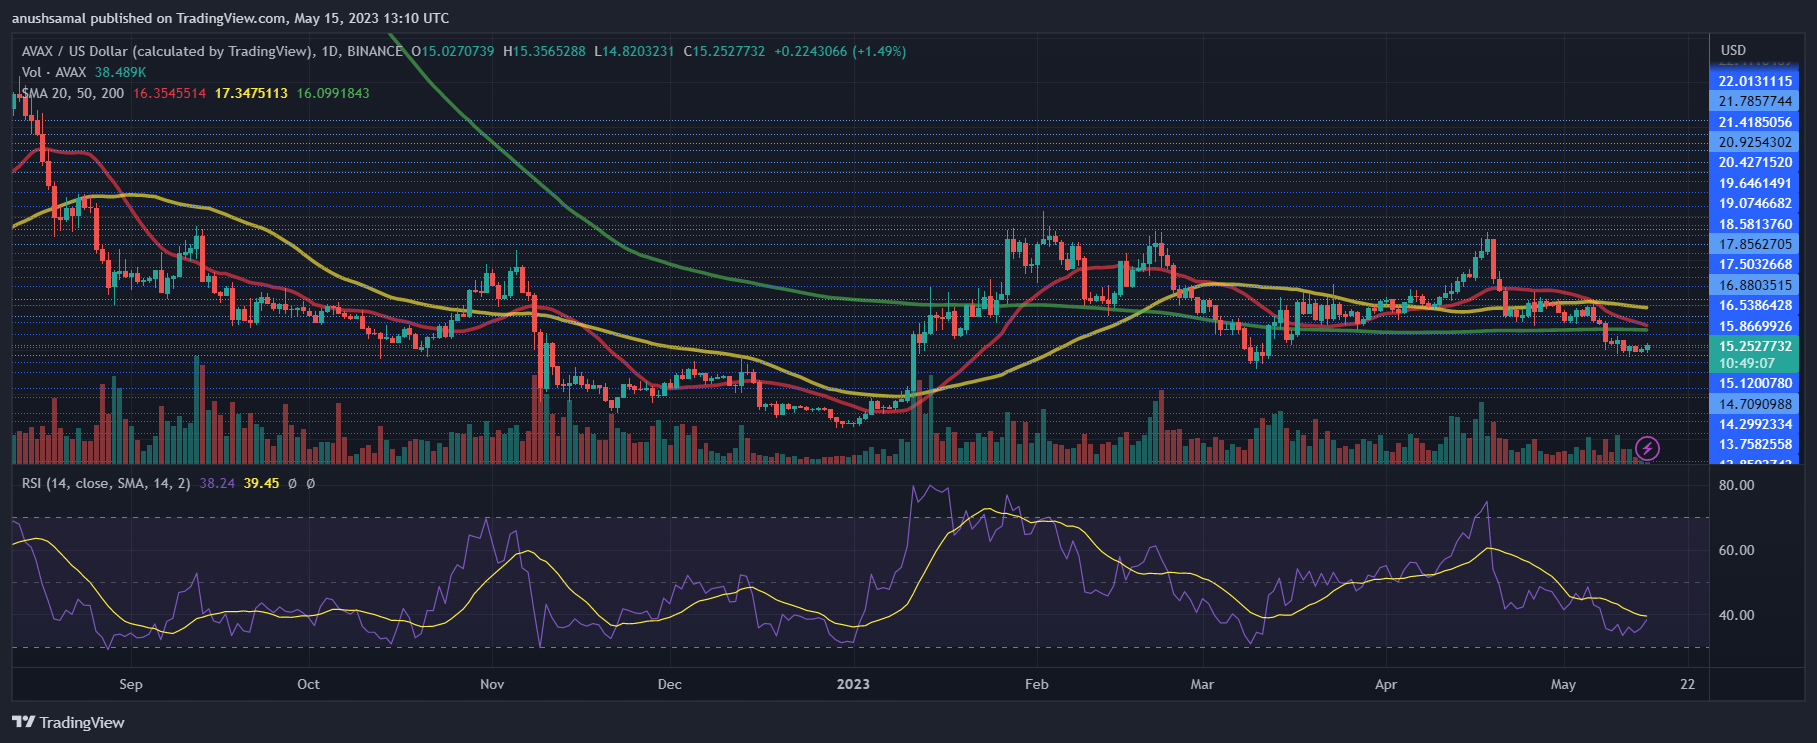
Throughout this month, AVAX has lacked significant buying strength. Currently, the Relative Strength Index (RSI) is slightly above the 40-mark but below the half-line. Although there has been a slight increase in the RSI, sellers have been the driving force behind the price momentum in the market.
This aligns with the observation that the price of AVAX has fallen below the 20-Simple Moving Average line, indicating that sellers continue to drive the price momentum in the market.

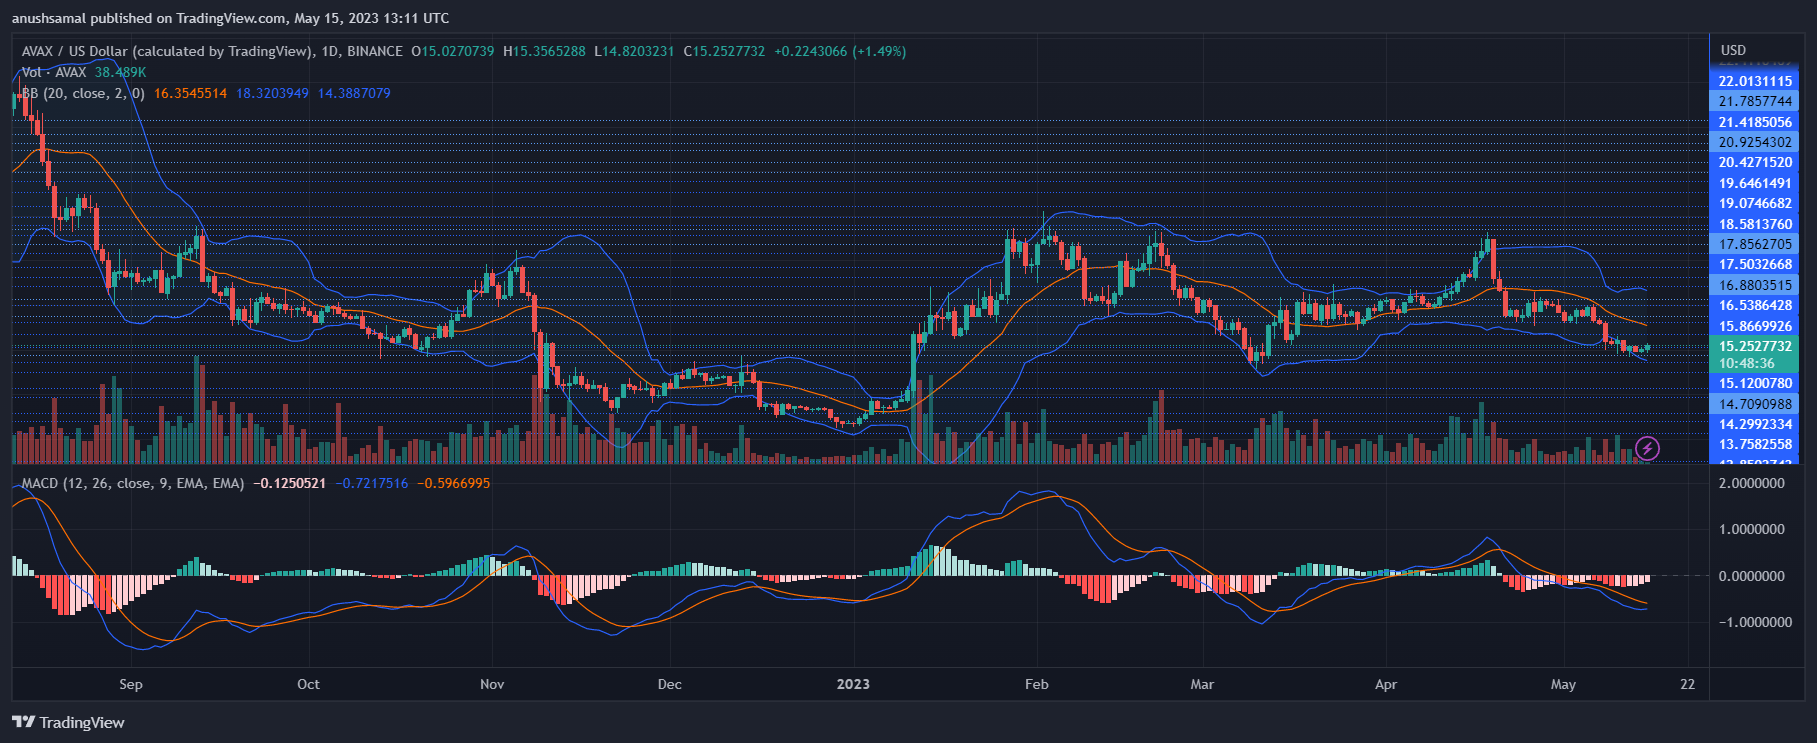
Despite a slight price increase in the past 24 hours, AVAX still shows sell signals on the chart. The Moving Average Convergence Divergence (MACD), an indicator of price momentum and reversals, has formed red histograms, indicating sell signals for the altcoin. This suggests a potential price decline before a recovery.
The Bollinger Bands, which represent price volatility and potential fluctuations, have remained wide, indicating that AVAX can anticipate price changes in upcoming trading sessions.
The upper band serves as a price ceiling, aligning with the resistance level at $16.


