Bitcoin’s liquid and illiquid supplies are very interesting and useful metrics for understanding market trends. Liquid supply refers to the amount of Bitcoin readily available for trading, meaning it is held in wallets that frequently engage in transactions. Highly liquid supply, a subset, denotes Bitcoin that moves even more frequently, often used by traders and exchanges. Illiquid supply, conversely, represents Bitcoin held in wallets that rarely move coins, suggesting long-term holding behavior.
Analyzing these supplies provides insight into market sentiment and potential future price movements. An increase in liquid supply usually indicates higher trading activity and potential selling pressure, while a rise in illiquid supply suggests accumulation and a bullish outlook, as holders expect prices to appreciate.
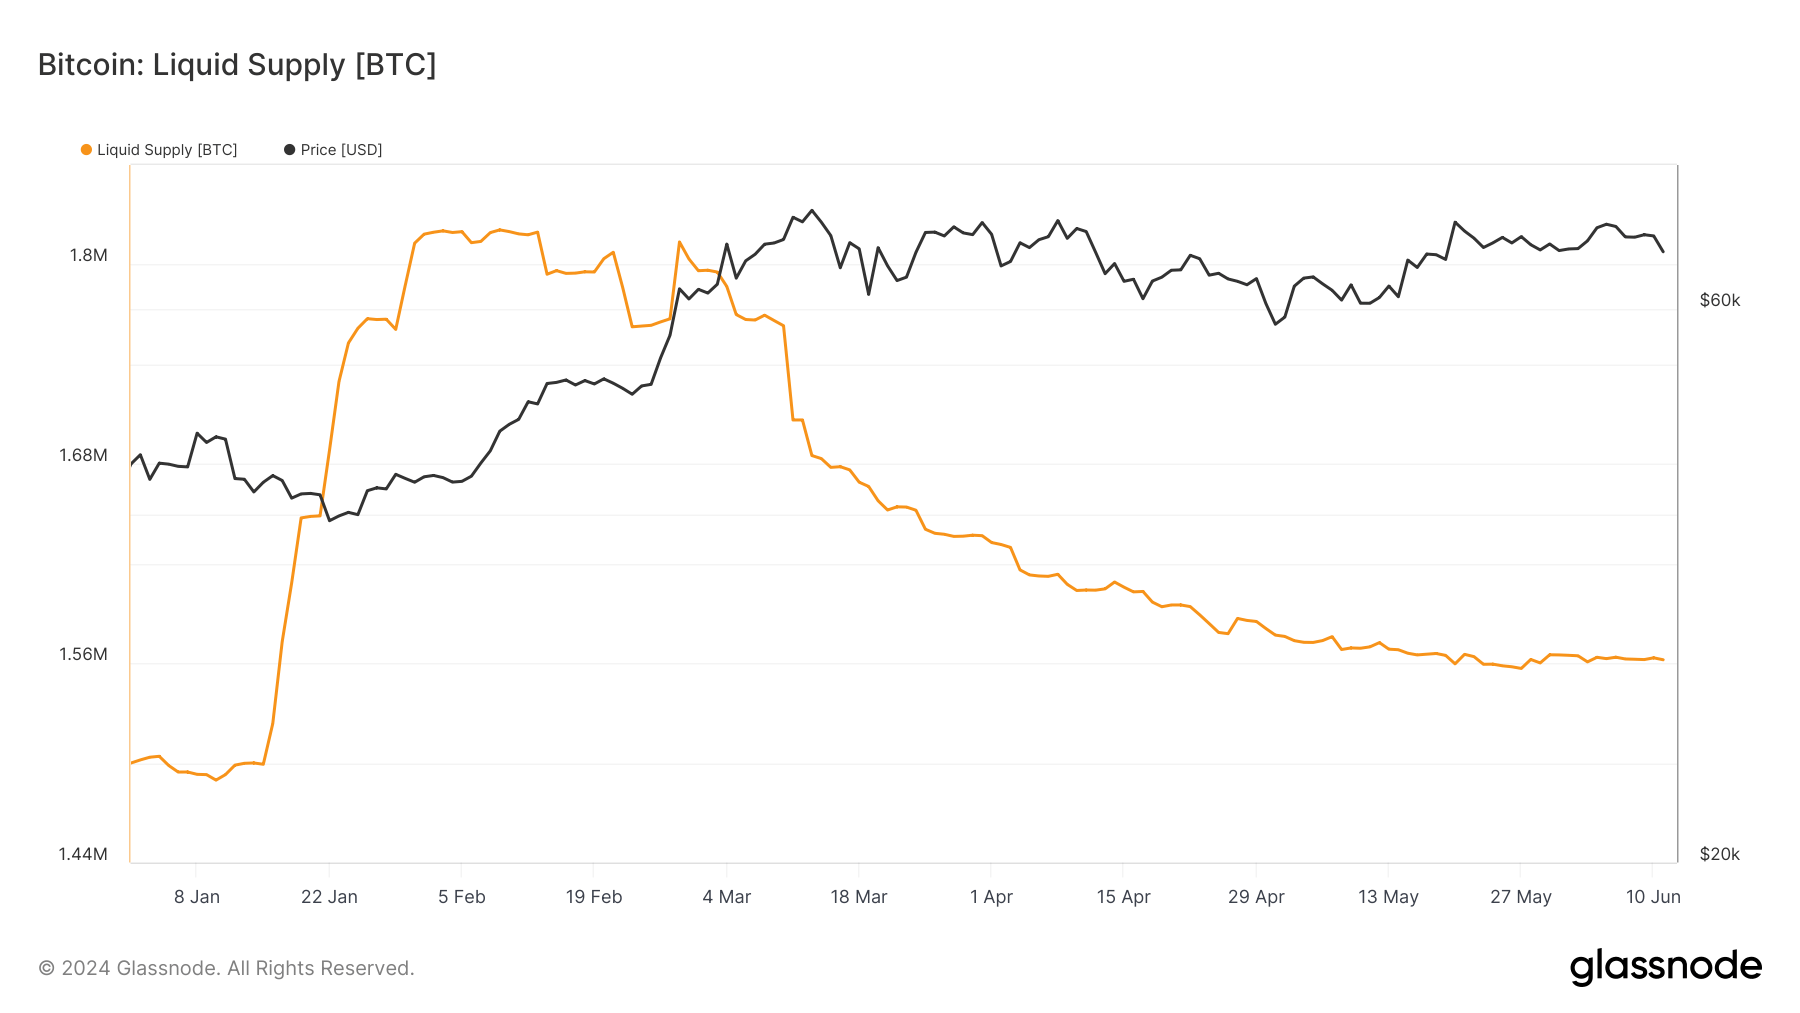
Throughout this year, we have seen significant fluctuations in these supplies. The liquid supply was at 1.501 million BTC on January 1 and increased to 1.813 million BTC by February 28. However, there was a consistent decline from April onwards, with the liquid supply dropping to 1.562 million BTC by June 11. This reduction signals a decrease in readily tradable Bitcoin, indicating reduced selling pressure as fewer coins are available for quick trades.
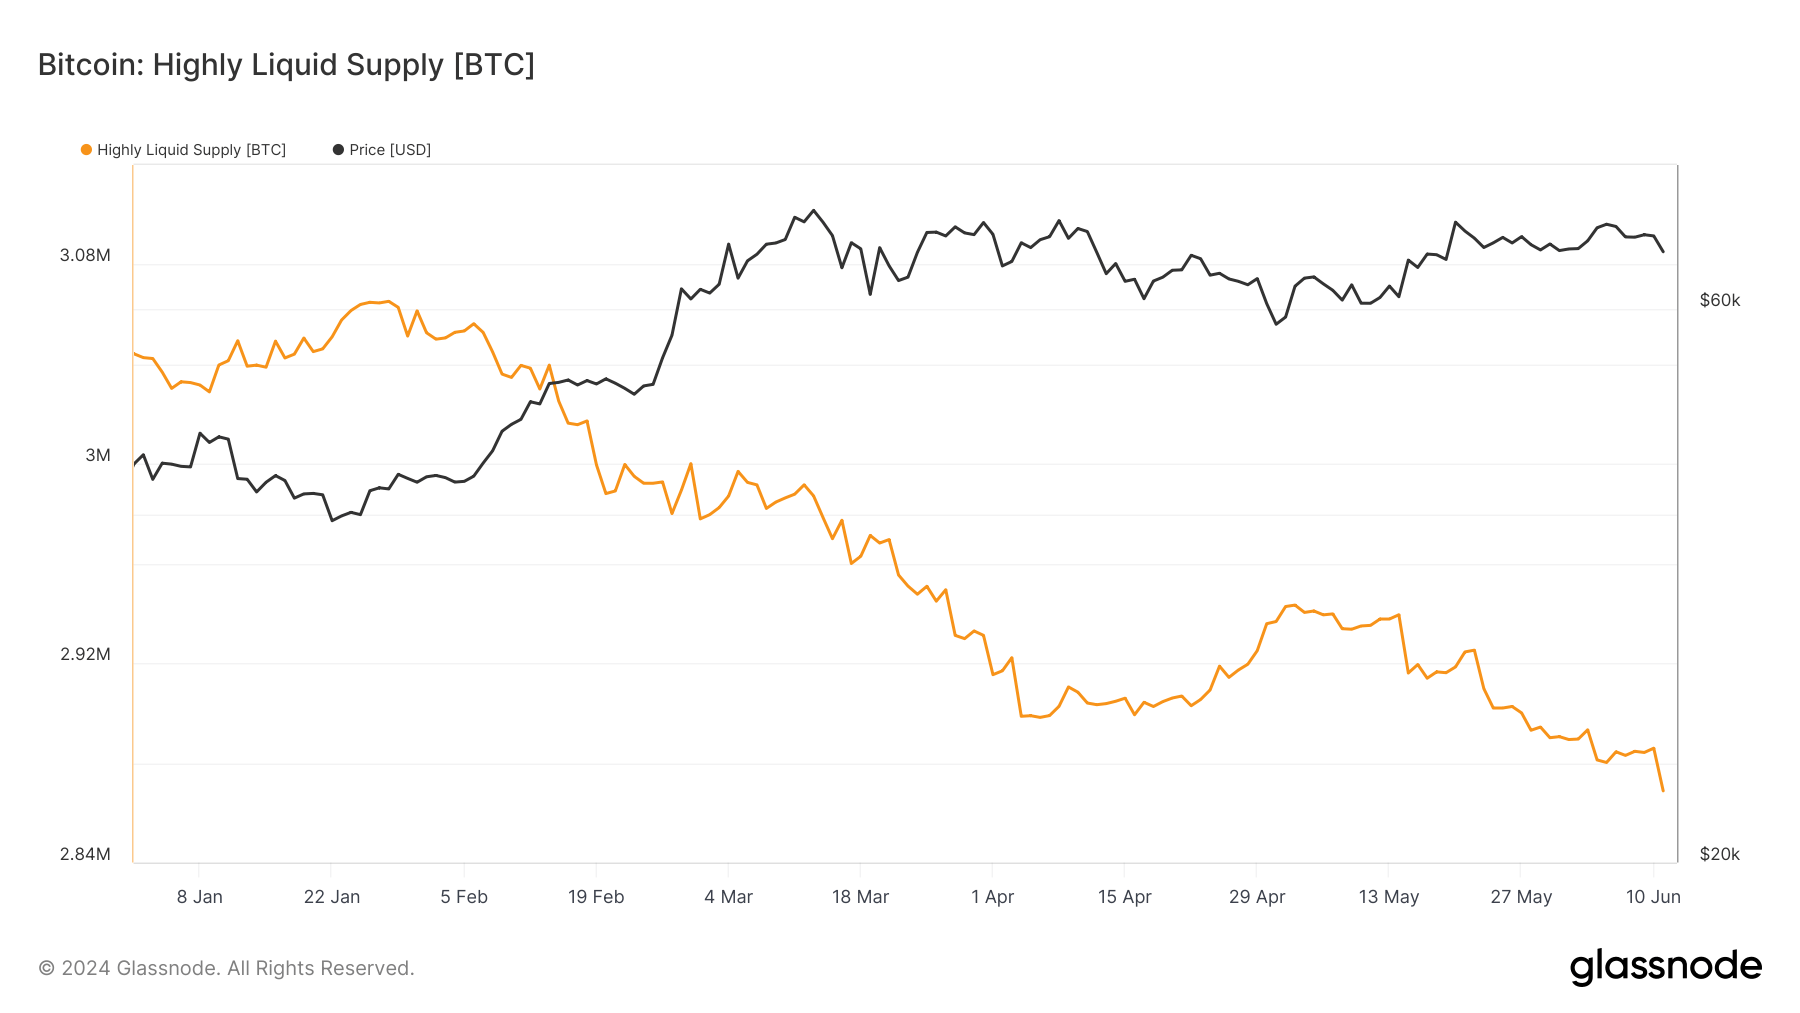
Highly liquid supply also declined, starting at 3.044 million BTC on January 1 and reaching 2.868 million BTC by June 11. This consistent drop over several months highlights a reduction in the most easily accessible Bitcoin, which could mean that active traders and exchanges are holding less, possibly due to a shift towards holding or reduced trading activity.
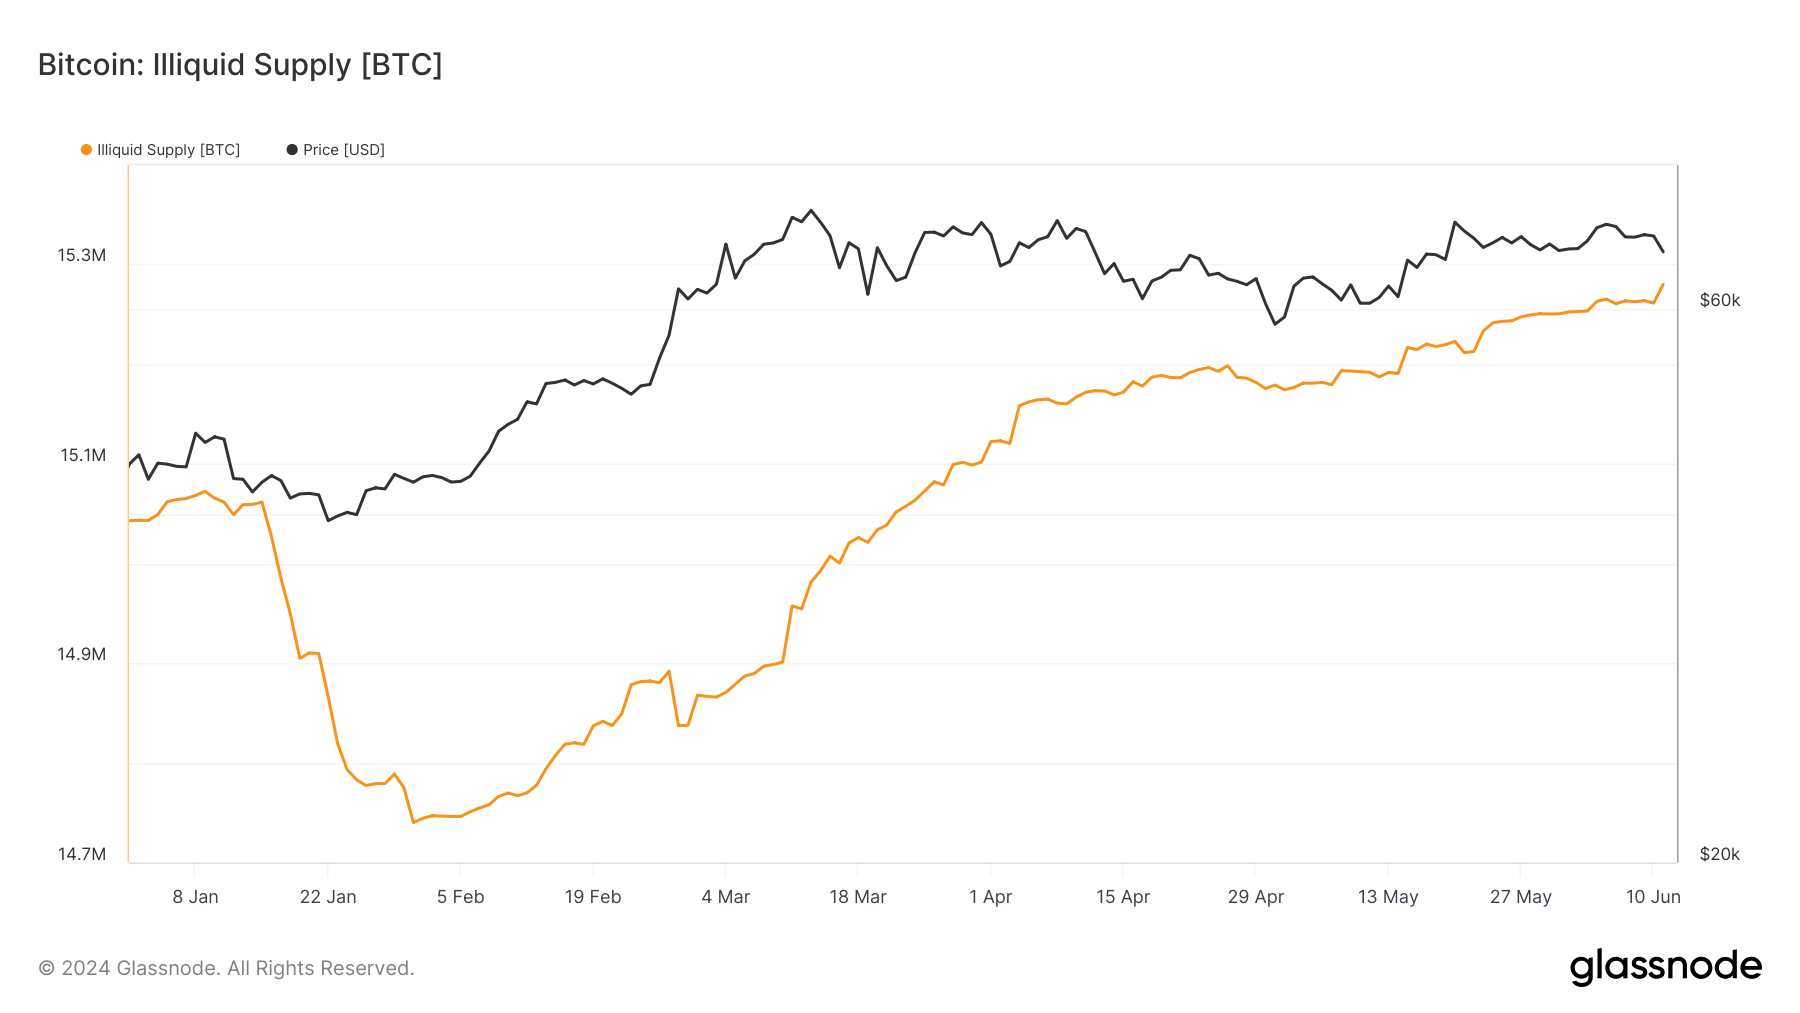
Conversely, the illiquid supply showed a steady increase. It began at 15.043 million BTC on January 1 and rose to 15.280 million BTC by June 11. This trend of increasing illiquid supply suggests that more Bitcoin is being moved into long-term storage, indicating confidence in Bitcoin’s future value and a decrease in the immediate availability of coins for trading.
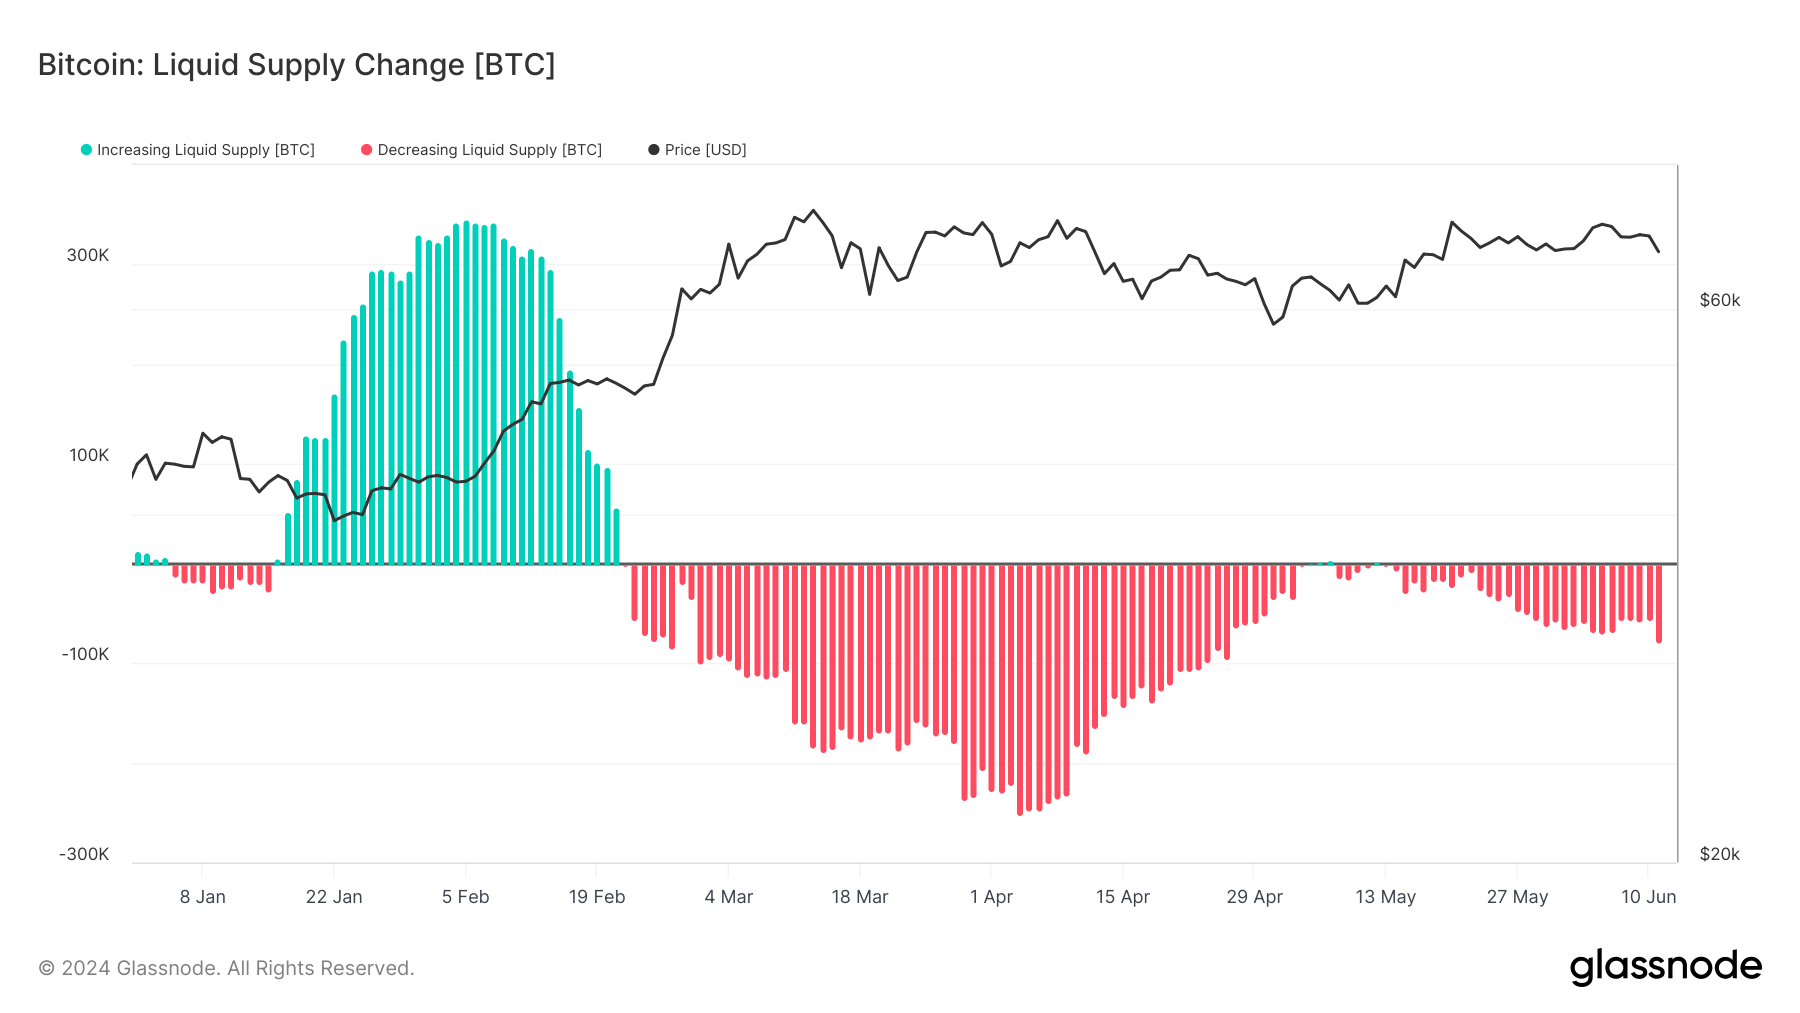
The 30-day net change data further supports these observations. The liquid and highly liquid supplies have been consistently negative since February 22, with the most substantial decline of 252,000 BTC on April 4. As of June 11, the net change remains negative at -79,306 BTC. This persistent negative change reinforces the idea that Bitcoin is continually moving out of liquid and highly liquid wallets, reducing market supply.
On the other hand, the illiquid supply’s 30-day net change has been positive since February 22, with a peak increase of 279,587 BTC on April 4. As of June 11, this net change stands at +92,834 BTC, indicating a robust and ongoing accumulation trend among long-term holders.
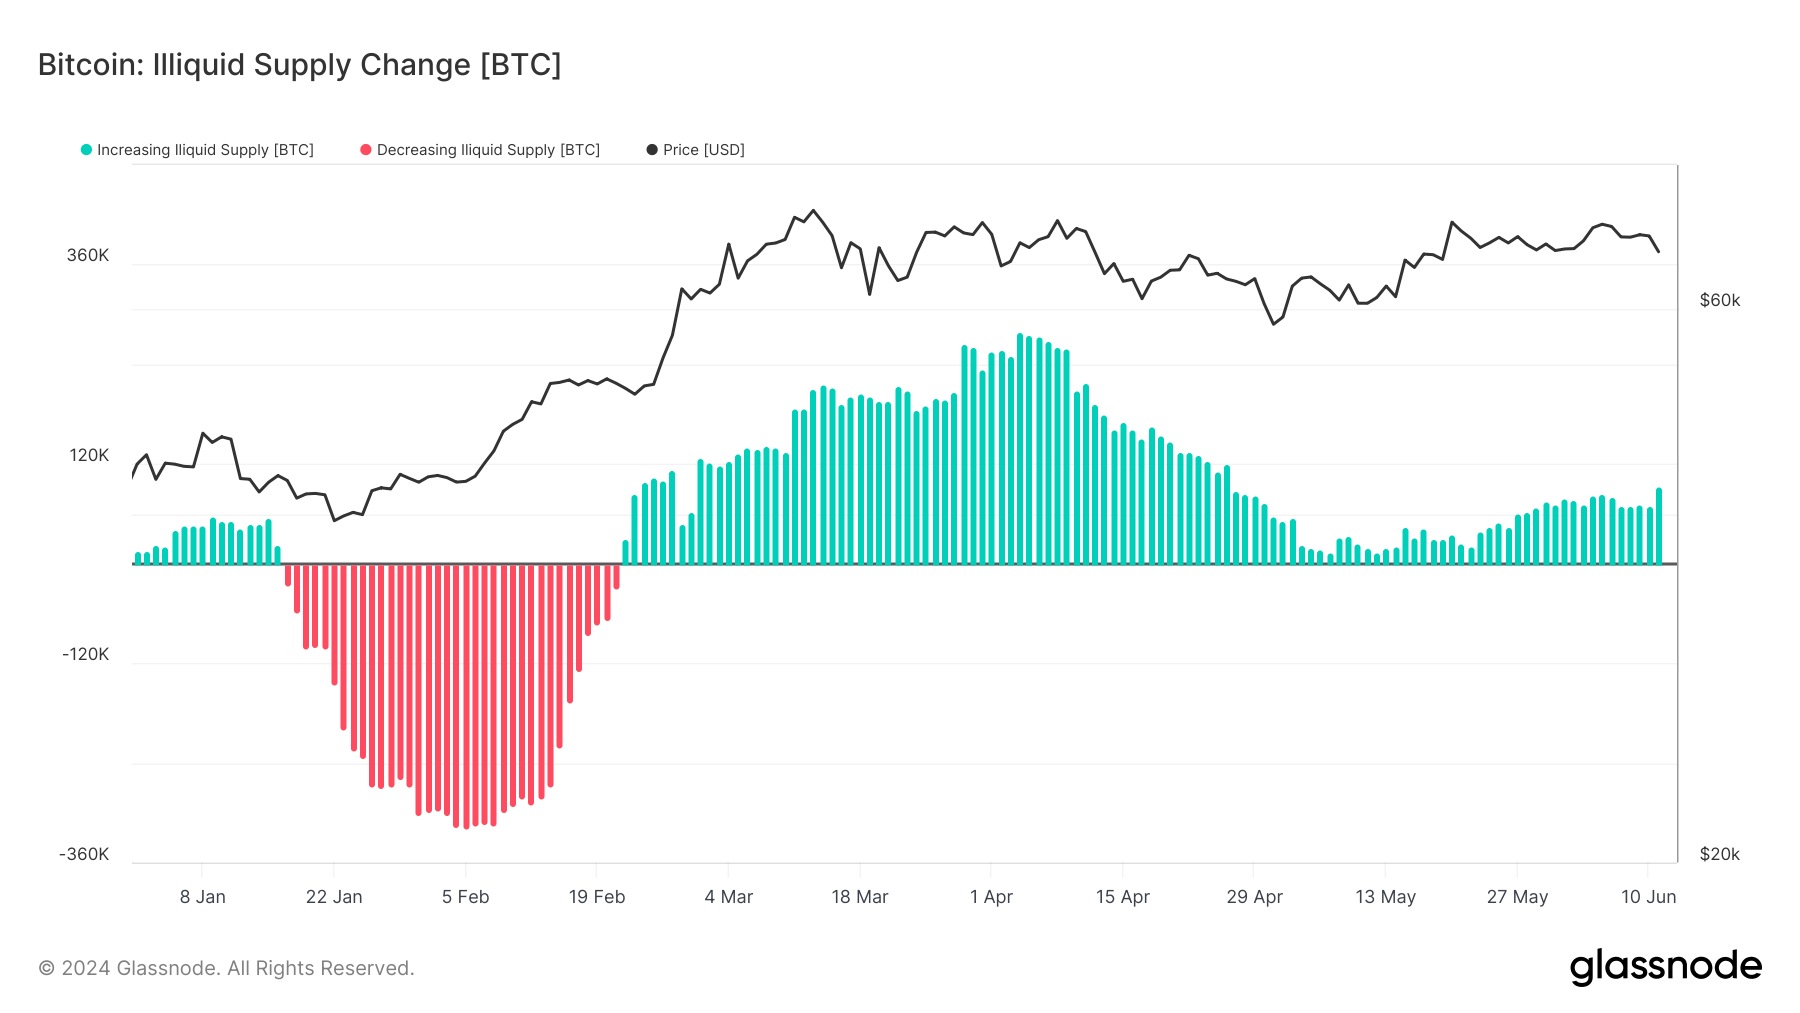
The patterns remain consistent when comparing the broader yearly trend to the past month. Both the liquid and highly liquid supplies continue to decrease, albeit at a slower pace, while the illiquid supply steadily grows. This continued divergence between liquid and illiquid supplies shows a market in which more participants are inclined towards holding rather than trading, reflecting a bullish sentiment.
The post Bitcoin’s liquid supply decreasing while illiquid confidence grows appeared first on CryptoSlate.


