The Ethereum price prediction is approaching a crucial level of support as the coin must have the support of $2000 to rise to $2500.
Ethereum Statistics Data:
- Ethereum price now – $2027
- Ethereum market cap – $240.1 billion
- Ethereum circulating supply – 120.8 million
- Ethereum total supply – 120.8 million
- Ethereum Coinmarketcap ranking – #2
ETH/USD Market
Key Levels:
Resistance levels: $2700, $2900, $3100
Support levels: $1500, $1300, $1100

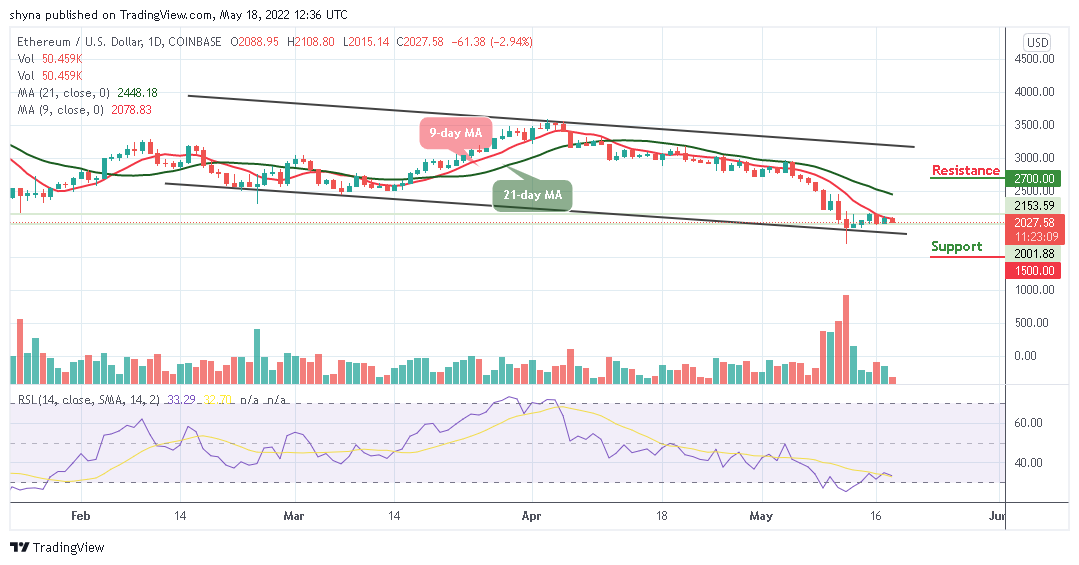
At the time of writing, ETH/USD is hovering at $2027 following a 2.94% loss after touching the $2108 levels. However, the Ethereum price has not seen any major pullbacks yet and may use the trend line of the channel for support if it happens. More so, the most important signal for Ethereum is the break of $2200, which represented a major resistance level. Therefore, should in the case bulls stay above this level, they may confirm a new uptrend.
Ethereum Price Prediction: Will ETH Break $2500 or Reverse?
As the Ethereum price remains below the 9-day moving average, the daily low at $2015 may continue to give the buyers sleepless nights. However, a break below the support level of $2000 could most likely give ETH/USD a fall below the lower boundary of the channel before reaching the critical supports at $1500, $1300, and $1100.
Furthermore, the Relative Strength Index (14) confirms the bearish movement as the signal line heads below the 30-level. However, until the market finds a stable level to reinforce the uptrend, ETH/USD can continue the downtrend. Otherwise, the resistance level might be at $2500 while other resistance levels are at $2700, $2900, and $3100 respectively.
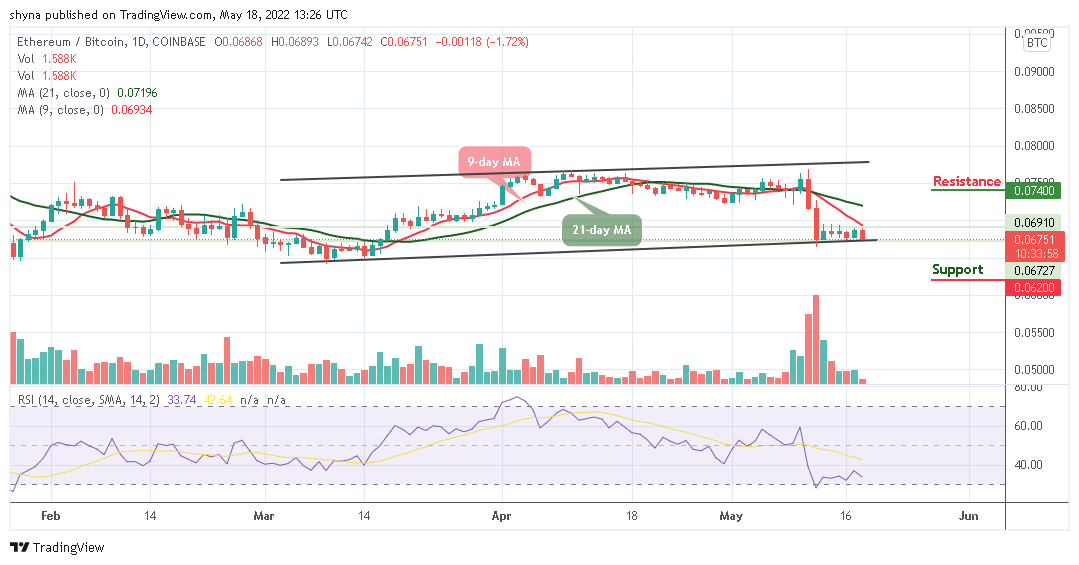
Against the BTC, the Ethereum price is ranging at the time of writing. However, as the price falls, sellers are posing an additional threat to buyers which could slump below the lower boundary of the channel where the nearest target is located. However, an eventual break below this barrier may cause the coin to collapse.

However, a continuation of the downtrend could touch the critical support at 0.062 BTC and below as the Relative Strength Index (14) is seen heading to the south. Meanwhile, if the price rebounds above the 9-day moving average, the buyers may resume back and push the market to the potential resistance at 0.074 BTC and above.
Looking to buy or trade Bitcoin (BTC) now? Invest at eToro!
68% of retail investor accounts lose money when trading CFDs with this provider


